
'%3e%3cpath%20d='M8%200C12.4183%200%2016%203.58172%2016%208C16%2012.4183%2012.4183%2016%208%2016C3.58172%2016%200%2012.4183%200%208C0%203.58172%203.58172%200%208%200ZM11.6162%204.38379C11.2257%203.99337%2010.5927%203.99338%2010.2021%204.38379L8%206.58594L5.79785%204.38379C5.40732%203.99334%204.77429%203.99329%204.38379%204.38379C3.99331%204.77429%203.99335%205.40733%204.38379%205.79785L6.58594%208L4.38379%2010.2021C3.99348%2010.5927%203.99341%2011.2257%204.38379%2011.6162C4.77426%2012.0066%205.40734%2012.0065%205.79785%2011.6162L8%209.41406L10.2021%2011.6162C10.5927%2012.0066%2011.2257%2012.0067%2011.6162%2011.6162C12.0067%2011.2257%2012.0066%2010.5927%2011.6162%2010.2021L9.41406%208L11.6162%205.79785C12.0066%205.40735%2012.0066%204.77429%2011.6162%204.38379Z'%20fill='%23080E17'%20fill-opacity='0.46'/%3e%3c/g%3e%3cdefs%3e%3cclipPath%20id='clip0_3761_713'%3e%3crect%20width='16'%20height='16'%20fill='white'/%3e%3c/clipPath%3e%3c/defs%3e%3c/svg%3e)


'%3e%3cpath%20fill-rule='evenodd'%20clip-rule='evenodd'%20d='M21.4999%2010.9993C21.4999%205.20009%2016.7986%200.498901%2010.9993%200.498901C5.19994%200.498901%200.498657%205.20009%200.498657%2010.9993C0.498657%2016.2404%204.33858%2020.5844%209.35855%2021.3722V14.0346H6.69238V10.9993H9.35855V8.68594C9.35855%206.05427%2010.9262%204.60062%2013.3248%204.60062C14.4736%204.60062%2015.6753%204.80571%2015.6753%204.80571V7.38979H14.3512C13.0468%207.38979%2012.64%208.19921%2012.64%209.0296V10.9993H15.5523L15.0867%2014.0346H12.64V21.3722C17.66%2020.5844%2021.4999%2016.2404%2021.4999%2010.9993Z'%20fill='%231568EA'/%3e%3c/g%3e%3c/svg%3e)


It may not be easy for you to create a line chart in Excel, but that does not mean that it is an impossible task. There are a variety of methods which allows you to place or remove error bars without much complication. Here you can find a guide on how to add error bars in Excel since it has been used for data trends for a long time.
One of the reasons people want to know how to add error bars in Excel is because of margin and standard deviation issues. This lets you know any error or deviation in each graphic marker, facilitating your work. Here are the steps by steps of how to add error bars in Excel online, and get perfect graphs by using these effective techniques.
How to Add Error Bars in Excel
To begin, let's understand the different types of error bars that you can add in Excel:

Fixed Value: These error bars represent a specific fixed value for all data points.
Percentage Error: These error bars represent a percentage of the data point value.
Standard Deviation: These error bars represent the standard deviation of the data points.
Standard Error: These error bars represent the standard deviation divided by the square root of the sample size.
Let's use the following example dataset to demonstrate how to add error bars in Excel:

Now, let's go through the steps on how to add error bars in excel:
Step 1: Select the data points for which you want to add error bars in Excel.

Step 2: Go to the "Insert" tab in Excel.
Step 3: In the "Charts" group, click on the desired chart type that best represents your data, such as "2D Column."

Step 4: With the chart selected, click on the "Chart Elements" button (the plus icon) that appears at the top-right corner of the chart.
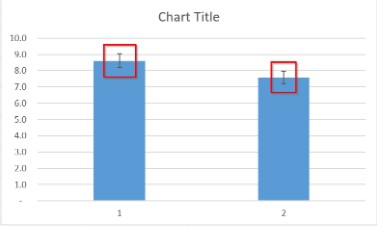
Step 5: From the drop-down menu, hover over "Error Bars" and choose the desired type of error bars, such as "Standard Error," "Percentage," "Fixed Value," or "Standard Deviation."

You have successfully added error bars in Excel to visualize the uncertainties or variations in your data.
How to Add Custom Error Bars in Excel
In addition to standard error bars, Excel allows you to add custom error bars that vary for each data point. Let's explore how to add custom error bars in Excel:
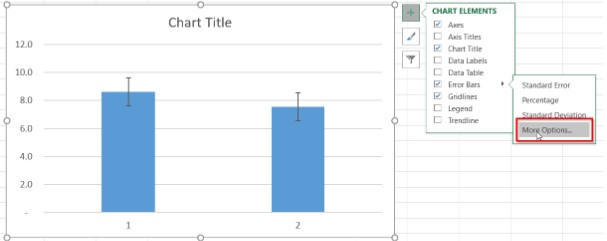
Step 1:First, select the chart you want to work with. Next, locate and click on the plus icon, also known as "Chart Elements." Instead of selecting the type of error directly, choose the "More Options" feature..
Step 2: In the "Error Bars Options" dialog box, select the "Custom" option.

Step 3: Specify the positive and negative error values for each data point using cell references or fixed values.
Step 4: Click "OK" to apply the custom error bars to your chart in Excel.

How to Add Individual Error Bars in Excel
In certain situations, you may find it necessary to add individual error bars with different lengths to each data point in a series. To achieve this, simply follow the steps outlined below:
Step 1: Select the data points for which you want to add custom error bars in Excel. For this example, we have calculated Standard Deviation using the STDEV formula.

Step 2: Select Custom Error Amount as guided above to specify values.
Step 3: Specify the positive and negative error values for each data point using cell references or fixed values.


Step 4: Click "OK" to apply the custom error bars to your chart in Excel.
How to Modify Error Bars in Excel
After adding error bars in Excel, you might want to modify their appearance or properties. Here's how you can do it:
Step 1: Click on the chart to select it in Excel.
Step 2: Go to the "Chart Design" tab in Excel.
Step 3: In the "Chart Layouts" group, click on the "Add Chart Element" button.

Step 4: From the drop-down menu, hover over "Error Bars" and choose "More Error Bars Options."

Step 5: In the "Error Bars Options" dialog box, you can modify various parameters such as error amount, end style, and error bar direction.

Step 6: Personalize the error bars to align with your preferences. In this step, you have the freedom to customize various aspects of the error bars.
Step 7: Click "OK" to apply the modifications to your chart in Excel.
How to Delete Error Bars in Excel
If you wish to remove error bars from your chart in Excel, follow these simple steps:
Step 1: Click on the chart to select it in Excel.
Step 2: Go to the "Chart Design" tab in Excel.
Step 3: In the "Chart Layouts" group, click on the "Add Chart Element" button.
Step 4: From the drop-down menu, hover over "Error Bars" and choose "None."

Step 5: The error bars will be removed from your chart in Excel.

Why Use WPS Office?

While the methods mentioned above are applicable to both Microsoft Excel and WPS Office Spreadsheet, we recommend using WPS Office for several reasons:
Price:
WPS Office provides a free version with robust features, making it a cost-effective choice for adding error bars in Excel.
Compatibility:
WPS Office offers seamless compatibility with Microsoft Office files, ensuring smooth collaboration with colleagues or classmates.
Features:
WPS Office comes with a wide range of features and functions that enhance your productivity and data analysis capabilities.
User-friendly Interface:
WPS Office provides a user-friendly interface, making it easy for beginners to navigate and utilize the error bar functionality in Excel.
FAQs
Q1: How to add error bars in Excel Mac?
A1: The steps to add error bars in Excel Mac are similar to those mentioned above for Windows. Simply follow the instructions provided in this article on how to add error bars in Excel, and you'll be able to add error bars in Excel Mac effortlessly.
Q2: How to change the title of the graph once inserted in Excel?
A2: To change the title of a graph once inserted in Excel, select the chart, click on the "Chart Title" text box, and edit the title as desired. You can also change the appearance of the title using various formatting options available in Excel.
Explore Excel’s Potential With WPS Spreadsheets
In this article, we have provided comprehensive coverage of the essential aspects of adding error bars in Excel. WPS Office, being an all-in-one office suite, offers seamless integration and easy interchangeability between its productivity tools. Among these tools, Excel stands out as an exceptional spreadsheet application that allows users to effortlessly utilize a wide range of essential functions.
With its user-friendly interface and intuitive features, Excel provides a powerful platform for managing and analyzing data. Users can easily incorporate error bars into their charts, enhancing data visualization and analysis. By utilizing Excel's extensive set of tools, users can generate insightful charts and graphs with error bars, thereby improving the accuracy and clarity of their data presentations. Download WPS Office now and cut down costs on your office suite needs!

'%3e%3cpath%20d='M19.9911%204.11386V6.471H18.5894C18.0775%206.471%2017.7322%206.57814%2017.5536%206.79243C17.3751%207.00671%2017.2858%207.32814%2017.2858%207.75671V9.44421H19.9019L19.5536%2012.0871H17.2858V18.8639H14.5536V12.0871H12.2769V9.44421H14.5536V7.49779C14.5536%206.39064%2014.8632%205.53201%2015.4822%204.92189C16.1013%204.31177%2016.9257%204.00671%2017.9554%204.00671C18.8304%204.00671%2019.509%204.04243%2019.9911%204.11386Z'%20fill='%23333333'/%3e%3c/g%3e%3cdefs%3e%3cclipPath%20id='clip0_2938_8199'%3e%3crect%20width='16'%20height='16'%20fill='white'%20transform='translate(8%204.00671)'/%3e%3c/clipPath%3e%3c/defs%3e%3c/svg%3e)
'%3e%3cpath%20d='M17.5237%2010.7813L23.4811%204H22.0699L16.8949%209.88693L12.7648%204H8L14.2469%2012.9029L8%2020.0133H9.4112L14.8725%2013.7952L19.2352%2020.0133H24M9.92053%205.04213H12.0885L22.0688%2019.0224H19.9003'%20fill='%23333333'/%3e%3c/g%3e%3cdefs%3e%3cclipPath%20id='clip0_2938_8200'%3e%3crect%20width='16'%20height='16.0134'%20fill='white'%20transform='translate(8%204)'/%3e%3c/clipPath%3e%3c/defs%3e%3c/svg%3e)


