Free All-in-One Office Suite with PDF Editor
Edit Word, Excel, and PPT for FREE.
Read, edit, and convert PDFs with the powerful PDF toolkit.
Microsoft-like interface, easy to use.
Windows • MacOS • Linux • iOS • Android

Excel data analysis add-in in Excel online
The Analysis ToolPak can help you develop intricate statistical or engineering studies faster and with fewer steps. The programme employs the required statistical or engineering macro functions to compute and present the findings in an output table once you supply the necessary data and parameters for each analysis. Some tools not only output tables but also charts. Only one worksheet at a time may be utilised with the data analysis features.
When you run a data analysis on grouped worksheets, the first worksheet will display the findings, while the following worksheets will display empty prepared tables. Recalculate the analysis tool for each worksheet to do data analysis on the remaining worksheets. The tools listed in the following sections are part of the Analysis ToolPak. Click Data Analysis in the Analysis category on the Data tab to get to these resources. You must load the Analysis ToolPak add-in application if the Data Analysis command is not accessible.
How to load and activate the data analysis add-in in excel online, 2016 and 2019
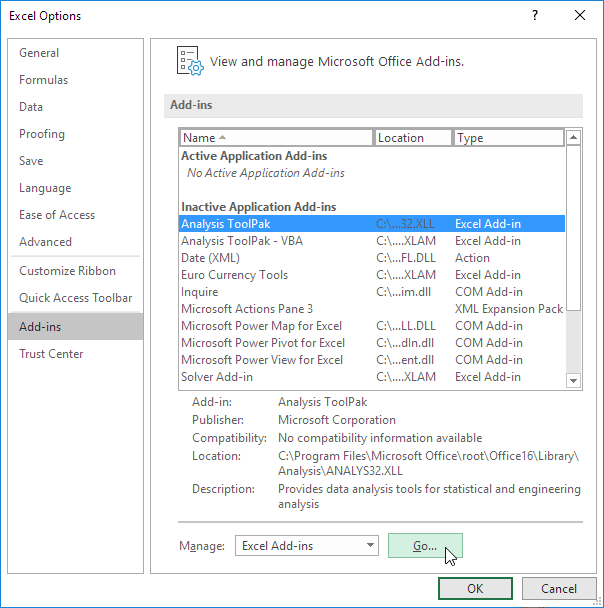
1.Select the Add-Ins category by selecting the File tab, Options, and then Add-Ins.

2. Select Excel Add-ins in the Manage box, then click Go.
If you're using Excel for Mac, select Tools > Excel Add-ins from the file menu.
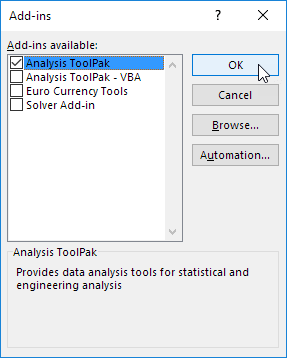
3. Check the Analysis ToolPak checkbox in the Add-Ins box, and then click OK.

4.Click Browse to find Analysis ToolPak if it isn't already listed in the Add-Ins available box.'
5.When requested to install the Analysis ToolPak if it isn't already on your machine, choose Yes.'
Correlation in excel
When measurements on each measurement variable are taken for each of N participants, the CORREL and PEARSON worksheet functions both compute the correlation coefficient between the two variables. (Any subject for which there are no observations is disregarded in the analysis.) When there are more than two measurement variables for each of N individuals, the correlation analysis tool is quite helpful. It offers a correlation matrix as an output table that displays the value of CORREL (or PEARSON) applied to every potential pair of measurement variables.
In contrast to the covariance, the correlation coefficient is scaled such that its value is independent of the units in which the two measurement variables are stated. The correlation coefficient and covariance are both measures of how much two measurement variables vary together. The value of any correlation coefficient must be between -1 and +1 inclusive (for instance, if the two measurement variables are weight and height, the value of the correlation coefficient remains unaffected if weight is translated from pounds to kilogrammes).
Each pair of measurement variables can be examined using the correlation analysis tool to see if they tend to move in tandem, i.e., if large values of one tend to be associated with large values of the other (positive correlation), small values of one tend to be associated with large values of the other (negative correlation), or if values of both tend to be unrelated (correlation near zero).
Note: This was an attempt to show you how to excel data analysis add-in in excel online, 2016 and 2019 in both windows and mac.
To get the newest version of WPS Office, you must first access this operating interface.
You just need to have a little understanding of how and which way things work. With having this basic knowledge or information of how to use it, you can also access and use different other options on excel or spreadsheet. Also, it is very similar to Word or Document. So, in a way, if you learn one thing, like Excel, you can automatically learn how to use Word as well because both of them are very similar in so many ways. If you want to know more about WPS Office, you can download WPS Office to access, Word, Excel, PowerPoint for free.
Also Read:
- 1. How to Conduct Data Analysis through Excel
- 2. How to add data analysis in excel online
- 3. How to add data analysis in excel(Easy Steps)
- 4. 10 Gorgeous Excel Graph Templates for Data Analysis and Visualization
- 5. 10 Data Collection Template Excel: Insights & Analysis Reports
- 6. How to Add Data Analysis in Excel: The Ultimate Guide
