
'%3e%3cpath%20d='M8%200C12.4183%200%2016%203.58172%2016%208C16%2012.4183%2012.4183%2016%208%2016C3.58172%2016%200%2012.4183%200%208C0%203.58172%203.58172%200%208%200ZM11.6162%204.38379C11.2257%203.99337%2010.5927%203.99338%2010.2021%204.38379L8%206.58594L5.79785%204.38379C5.40732%203.99334%204.77429%203.99329%204.38379%204.38379C3.99331%204.77429%203.99335%205.40733%204.38379%205.79785L6.58594%208L4.38379%2010.2021C3.99348%2010.5927%203.99341%2011.2257%204.38379%2011.6162C4.77426%2012.0066%205.40734%2012.0065%205.79785%2011.6162L8%209.41406L10.2021%2011.6162C10.5927%2012.0066%2011.2257%2012.0067%2011.6162%2011.6162C12.0067%2011.2257%2012.0066%2010.5927%2011.6162%2010.2021L9.41406%208L11.6162%205.79785C12.0066%205.40735%2012.0066%204.77429%2011.6162%204.38379Z'%20fill='%23080E17'%20fill-opacity='0.46'/%3e%3c/g%3e%3cdefs%3e%3cclipPath%20id='clip0_3761_713'%3e%3crect%20width='16'%20height='16'%20fill='white'/%3e%3c/clipPath%3e%3c/defs%3e%3c/svg%3e)


'%3e%3cpath%20fill-rule='evenodd'%20clip-rule='evenodd'%20d='M21.4999%2010.9993C21.4999%205.20009%2016.7986%200.498901%2010.9993%200.498901C5.19994%200.498901%200.498657%205.20009%200.498657%2010.9993C0.498657%2016.2404%204.33858%2020.5844%209.35855%2021.3722V14.0346H6.69238V10.9993H9.35855V8.68594C9.35855%206.05427%2010.9262%204.60062%2013.3248%204.60062C14.4736%204.60062%2015.6753%204.80571%2015.6753%204.80571V7.38979H14.3512C13.0468%207.38979%2012.64%208.19921%2012.64%209.0296V10.9993H15.5523L15.0867%2014.0346H12.64V21.3722C17.66%2020.5844%2021.4999%2016.2404%2021.4999%2010.9993Z'%20fill='%231568EA'/%3e%3c/g%3e%3c/svg%3e)


A Gantt chart is a powerful graphical representation used to illustrate a timeline, making it particularly useful for displaying the sequence of tasks and activities within a project. This visualization aids in keeping projects on schedule. In this article, we will provide a comprehensive guide on how to Create an Excel Gantt Chart in WPS Office, ensuring you can effectively utilize this tool to manage your projects.

What is WPS Office?
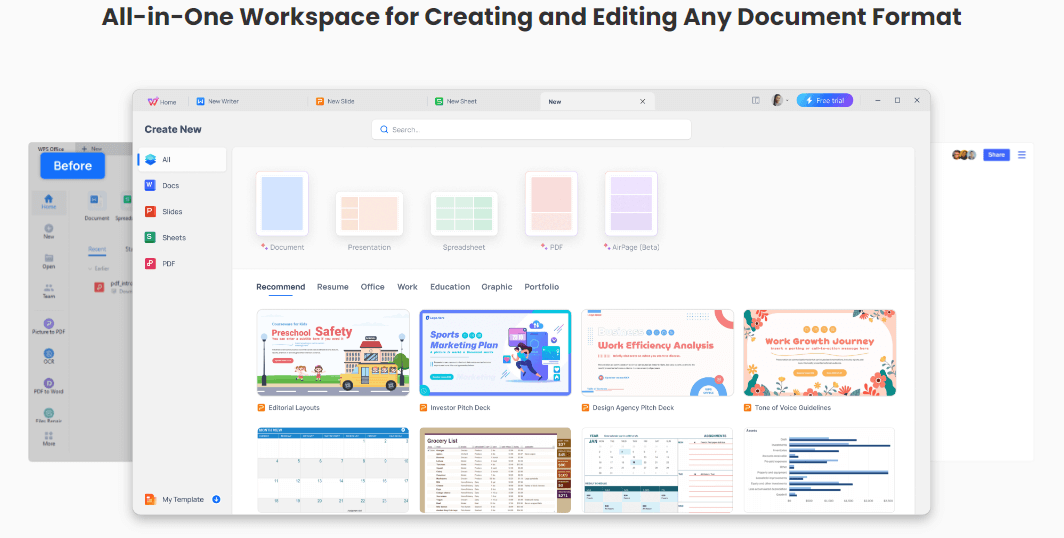
Firstly, let's clarify what WPS Office truly represents. It's an exceptionally comprehensive office suite, distinguishing itself from traditional alternatives. This all-in-one suite provides users with seamless access to an array of productivity tools, all within a single window.

You have a Writer for document creation, a Spreadsheet for data management, and a Presentation for crafting impactful slides. However, what truly sets WPS Office apart is its remarkable user-friendliness. There are no unnecessary obstacles or steep learning curves to contend with, making it a smooth and efficient experience. Moreover, it boasts integrated AI capabilities, further enhancing its capabilities.
How to Create an Excel Gantt Chart in WPS Office
Create an Excel Gantt chart Using WPS Office
Creating an Excel Gantt chart using WPS Office is a straightforward process, thanks to the user-friendly tools and intuitive interface provided by WPS Office. Here's a step-by-step guide on how to create an Excel Gantt chart in WPS Office:
Step 1: Prepare Your Project Table
To create an event planning Excel Gantt chart, start by setting up a project table with all the necessary information: event activities, start and end dates, and durations. You can calculate the duration for each activity using Excel formulas, such as the SUM function (duration = end date - start date).

Step 2: Insert the Chart
Select the "Start Date" column and navigate to the "Insert" tab.
Click on "Chart" in the ribbon menu.

Step 3: Choose the Chart Type
In the "Insert Chart" dialog box, go to the "Bar" section in the navigation pane.
Select "Stacked Bar".

Step 4: Customize the Chart Data
A bar chart will be displayed. Right-click the chart and select "Select Data".

In the "Edit Data Source" dialog box, click the "+" icon to add the "Duration" series.

Step 5: Edit Series
In the "Edit Series" dialog, enter "Duration" as the series name.
In the "Series Values" field, select the "Duration" column and press "OK".

Step 6: Define Axis Labels
In the "Axis Label" section, click on the edit icon and select the "Activity" column for the "Axis label range".

Step 7: Adjust Formatting
To remove the "Start Date" bars, right-click on a start date bar and choose "Format Data Series".

In the formatting window, under the "Fill & Line" tab, select "No Fill" and "No Line".

Step 8: Reverse Categories
To reverse the categories, click on the chart axes and then right-click to open the context menu.

Visit the “Axis” tab, make sure the “Categories in Reverse Order” checkbox is unchecked under the Axis Position section

Step 9: Fine-Tune Gantt Chart Appearance
Adjust the minimum bounds to reduce white space around the bars.

Modify the spacing between dates on the horizontal axis to optimize chart readability.

Make task bars thicker or thinner by adjusting the gap width

.
Customize taskbars, chart area, and add a title for a polished finish.
Create an Excel Gantt chart Using WPS Office Mobile
Users can utilize the WPS mobile app on their Android and iOS devices to effortlessly create free daily planning Excel Gantt charts.
Step 1: Launch the WPS Office app on your mobile device.

Step 2: Tap on the Discover option located at the bottom of the screen.

Step 3: Find the search box at the top of the page.

Step 4: Click on Templates.

Step 5: Tap on the search box and enter "Gantt Chart"
Step 6: Download and open the Gantt Chart. Professionals can now edit their project details and personalize this Gantt chart according to their project activities.


Tips for Inserting a Calendar
Use a calendar template: There are many free and paid calendar templates available for Excel. These templates will make it easy to insert a calendar into your Gantt chart and format it to match your project needs.
Use a custom date range: If your project doesn't fit into a standard calendar year, you can use a custom date range for your calendar. This will allow you to create a Gantt chart that shows the progress of your project over a specific period.
Use conditional formatting: Conditional formatting can be used to highlight different tasks or milestones on your Gantt chart. For example, you could use conditional formatting to highlight tasks that are overdue or that are at risk of being delayed.
Use a timeline: A timeline can be added to your Gantt chart to show the start and end dates of your project. This can help track progress and identify potential bottlenecks.
Where and How to Find a Gantt Chart Excel Template?
Although Excel doesn't offer built-in Gantt chart themes for presenting schedules, you'll find a valuable resource on the WPS website. You can explore an extensive collection of templates, including Gantt chart templates tailored to your specific needs. These templates cover a wide range of layout types, from the traditional horizontal layout to the versatile vertical format, ensuring you'll discover the perfect fit for your project management requirements.
How to download WPS Office?
To download WPS Office for your system, follow these simple steps:
Step 1: Visit WPS Office on your browser and find the “Download” placed at the center of the screen.

Step 2: Once the file has been downloaded, double-click to open, and start the installation process.
Step 3: When the installation is done, you can start using WPS Office on your computer. You can open it from your desktop or the Start menu.
FAQs
Q1. How to make a Gantt chart in PowerPoint?
To make a Gantt chart in PowerPoint, you can follow these simple steps:
Step 1: Open a new PowerPoint presentation and choose a blank slide.
Step 2: Go to the Insert tab and click on “Chart”. Select the “Stacked Bar” chart type and click “OK”.
Step 3: A sample chart and an Excel spreadsheet will appear. You can edit the data in the spreadsheet to match your project information. You need to enter the task names, start dates, durations, and end dates for each task. You can also change the labels for the axes and the title of the chart.
Step 4: To format the chart, you can right-click on any element and choose “Format”. You can change the colors, borders, effects, fonts, and other options to customize your chart.
Step 5: To hide the start date bars, you can select them and choose No Fill and No Line from the Format Data Series pane. This will make them invisible and only show the duration bars.
Step 6: To reverse the order of the tasks on the y-axis, you can right-click on any task name and choose “Format Axis”. Then check the Categories in the Reverse Order box from the Format Axis pane.
Step 7: To add axis titles, you can click on the icon at the top right corner of the chart and check the Axis Titles box. Then enter the titles for both axes.
Q2. Can I create an Excel Gantt chart using WPS Office for event planning?
Yes, WPS Spreadsheet is a user-friendly platform that offers the tools required to construct Gantt charts for event planning, enabling efficient organization, resource allocation, and understanding of schedules. It streamlines event logistics, manages team roles, and ensures timely completion of critical activities.
Q3. Can I make and edit Excel Gantt charts on my mobile device using WPS Office Mobile?
Yes, you can create and alter Gantt charts using the WPS Office on your mobile device, allowing you to manage projects and look at deadlines even while you're on the go. The mobile app enables you to effortlessly create and modify Gantt charts, making it easy to stay productive.
Q4. Can I use WPS Spreadsheet to make daily Gantt charts?
WPS Spreadsheet allows you to generate Gantt charts particularly suited for daily planning. This tool enables you to diligently plan your work, manage prime concerns adequately, and keep a record of your daily progress.
Efficient Project Management with WPS Office
In this article, we've offered a step-by-step guide on how to Create an Excel Gantt Chart in WPS Office, through which you'll be able to effectively depict your project timelines in a visually appealing format. One great thing about the Spreadsheet Excel Gantt chart is that it doesn’t have to limit to the spreadsheet alone. You can effectively represent it in the presentation as well as the writer tool. So start today and download WPS Office to enhance your productivity.

'%3e%3cpath%20d='M19.9911%204.11386V6.471H18.5894C18.0775%206.471%2017.7322%206.57814%2017.5536%206.79243C17.3751%207.00671%2017.2858%207.32814%2017.2858%207.75671V9.44421H19.9019L19.5536%2012.0871H17.2858V18.8639H14.5536V12.0871H12.2769V9.44421H14.5536V7.49779C14.5536%206.39064%2014.8632%205.53201%2015.4822%204.92189C16.1013%204.31177%2016.9257%204.00671%2017.9554%204.00671C18.8304%204.00671%2019.509%204.04243%2019.9911%204.11386Z'%20fill='%23333333'/%3e%3c/g%3e%3cdefs%3e%3cclipPath%20id='clip0_2938_8199'%3e%3crect%20width='16'%20height='16'%20fill='white'%20transform='translate(8%204.00671)'/%3e%3c/clipPath%3e%3c/defs%3e%3c/svg%3e)
'%3e%3cpath%20d='M17.5237%2010.7813L23.4811%204H22.0699L16.8949%209.88693L12.7648%204H8L14.2469%2012.9029L8%2020.0133H9.4112L14.8725%2013.7952L19.2352%2020.0133H24M9.92053%205.04213H12.0885L22.0688%2019.0224H19.9003'%20fill='%23333333'/%3e%3c/g%3e%3cdefs%3e%3cclipPath%20id='clip0_2938_8200'%3e%3crect%20width='16'%20height='16.0134'%20fill='white'%20transform='translate(8%204)'/%3e%3c/clipPath%3e%3c/defs%3e%3c/svg%3e)


