
'%3e%3cpath%20d='M8%200C12.4183%200%2016%203.58172%2016%208C16%2012.4183%2012.4183%2016%208%2016C3.58172%2016%200%2012.4183%200%208C0%203.58172%203.58172%200%208%200ZM11.6162%204.38379C11.2257%203.99337%2010.5927%203.99338%2010.2021%204.38379L8%206.58594L5.79785%204.38379C5.40732%203.99334%204.77429%203.99329%204.38379%204.38379C3.99331%204.77429%203.99335%205.40733%204.38379%205.79785L6.58594%208L4.38379%2010.2021C3.99348%2010.5927%203.99341%2011.2257%204.38379%2011.6162C4.77426%2012.0066%205.40734%2012.0065%205.79785%2011.6162L8%209.41406L10.2021%2011.6162C10.5927%2012.0066%2011.2257%2012.0067%2011.6162%2011.6162C12.0067%2011.2257%2012.0066%2010.5927%2011.6162%2010.2021L9.41406%208L11.6162%205.79785C12.0066%205.40735%2012.0066%204.77429%2011.6162%204.38379Z'%20fill='%23080E17'%20fill-opacity='0.46'/%3e%3c/g%3e%3cdefs%3e%3cclipPath%20id='clip0_3761_713'%3e%3crect%20width='16'%20height='16'%20fill='white'/%3e%3c/clipPath%3e%3c/defs%3e%3c/svg%3e)


'%3e%3cpath%20fill-rule='evenodd'%20clip-rule='evenodd'%20d='M21.4999%2010.9993C21.4999%205.20009%2016.7986%200.498901%2010.9993%200.498901C5.19994%200.498901%200.498657%205.20009%200.498657%2010.9993C0.498657%2016.2404%204.33858%2020.5844%209.35855%2021.3722V14.0346H6.69238V10.9993H9.35855V8.68594C9.35855%206.05427%2010.9262%204.60062%2013.3248%204.60062C14.4736%204.60062%2015.6753%204.80571%2015.6753%204.80571V7.38979H14.3512C13.0468%207.38979%2012.64%208.19921%2012.64%209.0296V10.9993H15.5523L15.0867%2014.0346H12.64V21.3722C17.66%2020.5844%2021.4999%2016.2404%2021.4999%2010.9993Z'%20fill='%231568EA'/%3e%3c/g%3e%3c/svg%3e)


Scatter plots offer a valuable tool for enhancing the visual representation of data. You can easily create scatter plots in Excel by inputting the corresponding values, allowing the graph to take shape, and providing a clearer perspective for data analysis. This article will guide you through the process of how to create an Excel scatter plot in a WPS Spreadsheet, enabling you to harness the power of scatter plots for improved data interpretation.
.

What is a Scatter Plot in Excel
A scatter plot in Excel is a graphical representation that helps depict the relationship between two variables. This two-dimensional graph maps the values of the two variables in consideration. Each data point is represented by a dot on the graph, and its placement indicates its corresponding values along the x-axis and y-axis. This approach allows us to discern the connection between the two variables and enables us to detect patterns, trends, or correlations within the dataset. By observing the distribution of these data points, we gain valuable insights into the underlying relationship, aiding in data analysis and decision-making.

How to Create an Excel Scatter Plot in WPS Spreadsheet
Scatter plots in WPS Office are useful for professionals in various fields. It can help professionals identify trends and correlations in the data. Also, Scatter plot interpretation allows them to make predictions and estimations based on the data. WPS Office Excels in all these facets: it enables effortless scatter plot creation, boasts a user-friendly interface for easy interpretation, facilitates seamless sharing with others, and supports collaborative efforts.
In this guide, we will show you how to create an Excel scatter plot in WPS Office, which is also known as an X-Y plot in this WPS Office.
Create a scatter plot Using WPS Office
The above-described scatter plot serves as a valuable tool for visualizing and analyzing data relationships. Let's look at a few scatter plot samples.
We have a simple dataset of "Study Hours" and "Test Scores" for a group of students. We'll create a scatter plot based on this data and interpret the insights we can gather from it.

Step 1: Select the columns that contain the test score and study hour data.

Step 2: Go to the Insert tab and find the option that says “Insert (XY) Scatter Chart”.
Step 3: Choose a scatter chart template that suits your data. You can select from different options such as a Scatter plot with trendlines, data markers, and other features that can enhance your data visualization and analysis.

Creating a scatter plot in Excel is easy and simple when we follow the steps. The interface is intuitive and we can find the right tabs and create charts quickly. However, the Chart Type options are quite small to see. Nevertheless, our charts are appealing and we can customize them with useful information for presenting and analyzing the scatter plot.

Customization of Scatter Plot in WPS Office
You can customize your scatter plot in WPS Office by adding a trendline, changing colors, adding axis titles, and other useful options.
Step 1: Add a trendline
To add a trendline to your scatter chart, click on the “Chart Element” icon on the top right corner of the chart. Check the “Trendline” box. You can choose from different types of trendlines such as linear, exponential, and others.

Step 2: Add axis titles
Select "Axis Titles" by clicking on the "Chart Element" icon once again. You can edit the axis titles by renaming them, and changing their font style and size.

Step 3: Edit Chart Title
Simply click on the Title text box and change the name of your chart.

Step 4: Modify data markers
Double-click on any of the data markers, and a formatting option will appear on the right side. You can add a shadow to highlight the markers, change their color, or adjust their size.

Step 5: Change the Scatter Plot theme
Change the look of your Scatter Plot by clicking on the “Chart Style” icon on the top right corner of the chart. Select a style that you like from the available options.

Tips for Inserting a Scatter Plot
Data Preparation: Ensure your data is properly organized with clear pairs of x and y values before creating the scatter plot.
Scaling: Set appropriate scales for your axes to ensure that data points are visible and spaced evenly.
Marker Customization: Customize markers (symbols) for your data points to differentiate between them easily, especially if you have multiple data series.
Trendlines and Error Bars: Consider adding trendlines to highlight overall trends in the data, and error bars to represent variability or uncertainty.
Microsoft Office Compatibility in WPS
WPS Office is gaining prominence across various domains, emerging as a top-tier office suite that surpasses even more established contenders you might already recognize. Offering a comprehensive and entirely free office suite, WPS caters to users across Windows, macOS, Linux, and mobile devices including Android and iPhones. This unmistakably positions it as a significant player in the realm of office suites, introducing exceptional conveniences such as its user-friendly interface and the all-in-one office solution.

Transitioning to WPS Office is seamlessly accomplished within a matter of minutes, and it's cost-free. Once you've downloaded WPS, compatibility issues fade away. The formats and document quality remain consistent, ensuring a smooth transition that retains the same high standards as before.


Why Use WPS Office
WPS Office is a divine offering in the digital world of Office Suites that is designed to elevate your productivity and efficiency. The real question arises: why not embrace the power of the WPS Office? This comprehensive suite encompasses all the essential productivity tools tailored to meet your diverse needs.

Within WPS Office, the Spreadsheet tool stands out with its user-friendly interface. The Spreadsheet tool takes the complexity out of calculations, surpassing Excel in its simplicity and ensuring smooth formula integration. The Presentation tools provide a seamless platform for delivering captivating presentations, ensuring you effortlessly master the art of engaging audiences. Moreover, the Writer tool empowers you with an array of features to effortlessly craft impactful reports and letter templates.

One of the remarkable features of WPS Office is its unified all-in-one approach—under a single window, you can access the entire suite, streamlining your workflow. In essence, WPS Office transforms your work experience into an all-encompassing, productive journey.
How to download WPS Office?
Step 1: Maneuver to WPS Office on your browser and click on the “Download” button on the top right of the screen.

Step 2: Once the file is downloaded, double-click it to start installing it.
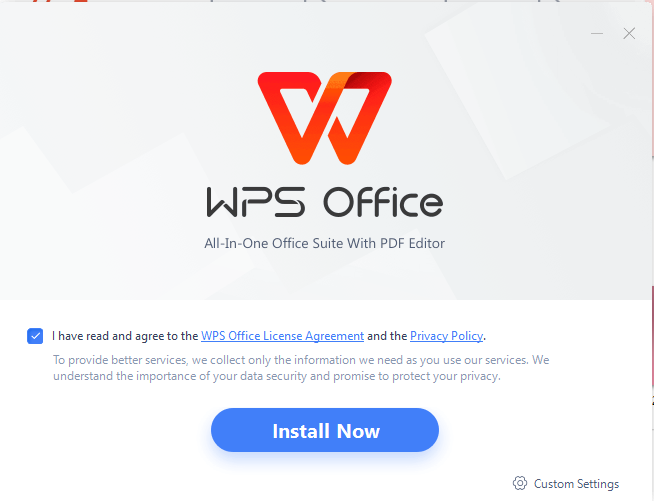
Step 3: You can use the WPS Office after the installation is complete.

FAQs
Q1. Can a scatter plot have error bars?
Yes, scatter plots can have error bars. Error bars in scatter plots can be displayed for both x and y values. These error bars provide valuable information about the variability and uncertainty associated with each data point along both axes
Q2. Can I add labels to my scatter plot in WPS Spreadsheet?
Yes, you can. WPS Spreadsheet allows adding labels to scatter plots to enhance visualizations and emphasize data points. This tool enhances clarity, highlights significant patterns, and generates detailed data presentations.
Q3.Is it possible to create a scatter plot that includes multiple data sets in WPS Office?
Yes, WPS comes with the capability to create scatter plots from several data sets. This feature serves its purpose when you want to explore and evaluate relationships between many variables in a single comprehensive display. You can effortlessly observe patterns, correlations, and discrepancies between different sets of data, making your analysis more informative.
Q4. Can I customize the look of my scatter plot in the WPS Office?
Yes, you can. WPS Office allows you to customize scatter plots by modifying the colors, markers, and labels to create aesthetically appealing and effective data presentations. Personalize scatter plots for informative, visually engaging data presentations using WPS Spreadsheet.
Mastering Excel Scatter Plots in WPS Spreadsheet
In this article, we unveiled the step-by-step process of how to create an Excel scatter plot in the WPS Spreadsheet. This guide is designed to enhance your understanding of relationships between two variables, allowing you to analyze them with clarity on the WPS Spreadsheet platform. If you want to gain deeper insights, take the next step and download WPS Spreadsheet now.

'%3e%3cpath%20d='M19.9911%204.11386V6.471H18.5894C18.0775%206.471%2017.7322%206.57814%2017.5536%206.79243C17.3751%207.00671%2017.2858%207.32814%2017.2858%207.75671V9.44421H19.9019L19.5536%2012.0871H17.2858V18.8639H14.5536V12.0871H12.2769V9.44421H14.5536V7.49779C14.5536%206.39064%2014.8632%205.53201%2015.4822%204.92189C16.1013%204.31177%2016.9257%204.00671%2017.9554%204.00671C18.8304%204.00671%2019.509%204.04243%2019.9911%204.11386Z'%20fill='%23333333'/%3e%3c/g%3e%3cdefs%3e%3cclipPath%20id='clip0_2938_8199'%3e%3crect%20width='16'%20height='16'%20fill='white'%20transform='translate(8%204.00671)'/%3e%3c/clipPath%3e%3c/defs%3e%3c/svg%3e)
'%3e%3cpath%20d='M17.5237%2010.7813L23.4811%204H22.0699L16.8949%209.88693L12.7648%204H8L14.2469%2012.9029L8%2020.0133H9.4112L14.8725%2013.7952L19.2352%2020.0133H24M9.92053%205.04213H12.0885L22.0688%2019.0224H19.9003'%20fill='%23333333'/%3e%3c/g%3e%3cdefs%3e%3cclipPath%20id='clip0_2938_8200'%3e%3crect%20width='16'%20height='16.0134'%20fill='white'%20transform='translate(8%204)'/%3e%3c/clipPath%3e%3c/defs%3e%3c/svg%3e)


