
'%3e%3cpath%20d='M8%200C12.4183%200%2016%203.58172%2016%208C16%2012.4183%2012.4183%2016%208%2016C3.58172%2016%200%2012.4183%200%208C0%203.58172%203.58172%200%208%200ZM11.6162%204.38379C11.2257%203.99337%2010.5927%203.99338%2010.2021%204.38379L8%206.58594L5.79785%204.38379C5.40732%203.99334%204.77429%203.99329%204.38379%204.38379C3.99331%204.77429%203.99335%205.40733%204.38379%205.79785L6.58594%208L4.38379%2010.2021C3.99348%2010.5927%203.99341%2011.2257%204.38379%2011.6162C4.77426%2012.0066%205.40734%2012.0065%205.79785%2011.6162L8%209.41406L10.2021%2011.6162C10.5927%2012.0066%2011.2257%2012.0067%2011.6162%2011.6162C12.0067%2011.2257%2012.0066%2010.5927%2011.6162%2010.2021L9.41406%208L11.6162%205.79785C12.0066%205.40735%2012.0066%204.77429%2011.6162%204.38379Z'%20fill='%23080E17'%20fill-opacity='0.46'/%3e%3c/g%3e%3cdefs%3e%3cclipPath%20id='clip0_3761_713'%3e%3crect%20width='16'%20height='16'%20fill='white'/%3e%3c/clipPath%3e%3c/defs%3e%3c/svg%3e)


'%3e%3cpath%20fill-rule='evenodd'%20clip-rule='evenodd'%20d='M21.4999%2010.9993C21.4999%205.20009%2016.7986%200.498901%2010.9993%200.498901C5.19994%200.498901%200.498657%205.20009%200.498657%2010.9993C0.498657%2016.2404%204.33858%2020.5844%209.35855%2021.3722V14.0346H6.69238V10.9993H9.35855V8.68594C9.35855%206.05427%2010.9262%204.60062%2013.3248%204.60062C14.4736%204.60062%2015.6753%204.80571%2015.6753%204.80571V7.38979H14.3512C13.0468%207.38979%2012.64%208.19921%2012.64%209.0296V10.9993H15.5523L15.0867%2014.0346H12.64V21.3722C17.66%2020.5844%2021.4999%2016.2404%2021.4999%2010.9993Z'%20fill='%231568EA'/%3e%3c/g%3e%3c/svg%3e)


Whether it is Excel, WPS, or Google Forms, when faced with a multi-step process or when confronted with a large amount of data, establishing a standardized flowchart can quickly help us analyze the situation. Although the flow chart is very useful, users often do not know how to set up the format.
So, how should we choose the right process template in the face of different data and process arrangements? We should choose to sort according to the requirements of the table.
Download Free Flowchart Templates Online
Many people look for free flowchart templates online. While there are many sources to get your flowchart collection running, it is recommended not to rely on them without authentication. Wrong templates can make even the simplest things difficult.
You can try reliable resources to learn how to create a flowchart in Excel. The best resource for reliable templates is the WPS Office. It is the top choice for people learning and struggling to create a flowchart in Excel. You can visit wps.com to explore a variety of content.
Here are a few effective templates you may want to download online from wps.com.


How to Make a Flowchart in Excel (Step-by-Step)
Many people want to learn how they can create a flowchart on their Excel file. Luckily, it is not an impossible task. Microsoft Office provides its users with a facility to use easy templates and customize them according to their preference.
Here is a step by step guide on how you can create a flowchart in Excel.
How to Create Basic Flowchart Shapes in Excel
Here is a step by step guide on how you can effectively create a flowchart with shapes in Excel.
Step 1: Open Excel on your device and go to the File tab

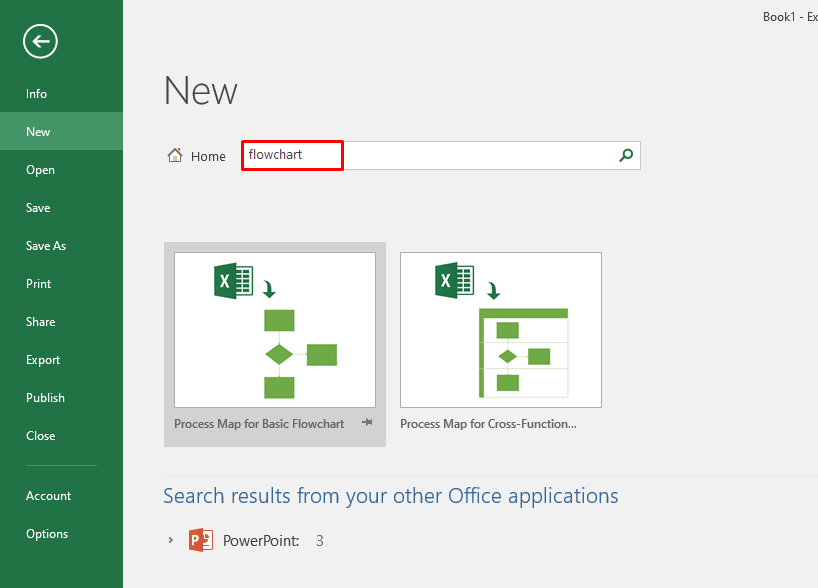
Step 2: Click New from the side panel to look for templates provided by Microsoft Excel.

Step 3: You can search for flowchart in the search bar to explore online templates provided by Microsoft Excel, which are designed to simplify creating this type of charts in Excel. Select any template and open it.
Step 4: If you do not have access to Visio, you can use your own tools to create a flowchart. You can go to the Insert option on the ribbon at the top and click Shapes. Further you can click on flowchart.

Step 5: Click on the Shapes that you want to add to your flowchart.

Step 6: Once you have inserted the shapes, you can freely resize and add text to them. You can also add text to the shapes and format is from the Home button according to your preferences.

Step 7: Now you can go back to the Shapes section and look for Connectors to give your flowchart a cleaner look.

Step 8: Once you add the connectors, you can add a title to your flowchart and remove the gridlines for a cleaner look. Go to the Page Layout section and deselect the View option to remove the gridlines.

How to Design Effective Flowcharts in Excel
If you are still unsure about how to make a flowchart in Excel, you may want to look for ways to make your charts effectively. Look no further, your guide is right below.
Fit All in One Page
You do not want the information of your flowchart flowing from one page to another. It can create a lot of confusion. Therefore, it is better to stick to one page.
Start from the Left
It is a universal rule to start your flowcharts from left to right. Following this practice can make your flow chart seem and read more professional.
Keep it Concise
It is best to avoid overwhelming your flowchart with data. You must prefer keeping it as concise as possible for best outcomes.
Use Labeling
You can easily use connected on the sides of the flowchart to show the action a step takes. This practice can make your flowchart more effective.
Test it Out
You may also want to test out your flowchart. You can read it out loud or ask another person for an opinion on the functionality of your flowchart.
How to Add Descriptions and Annotations in Excel
Many people who want to learn how to create a flowchart in Excel want to also learn how to add comments and explanations to the flowchart that has been made through pictures or dynamic demonstration diagrams. It is a simple step that can reduce the complexity of your flowchart.
Here is how you can add descriptions, annotations, and comments in flowcharts on Excel.
Step 1: Make right-click on the cell you want to add information to. Look for the Insert Comment option or choose the Edit Text option.

Step 2: You can hover on any part of the cells with the comments to view these comments.

Step 3: You can also go to the Show all Comments section to view all remarks at once.

How to Create Decision Points in Flowcharts in Excel
Besides learning how to create a flowchart in Excel, you may also want to know how to create decision points in flowcharts in Excel. The decision points that you use determine how effectively you can represent your data to the audience.
Here are some of the effective steps you can undertake to create decision points in flowcharts.
Step 1: Click the Shapes button in the Insert tab on the top ribbon. You can choose the shapes that determine your processes. For example, diamonds and rectangles are commonly used for decision points.

Step 2: You must also determine the decisions or question process with different shapes to make it more effective. You can also use the connectors to connect the flow of your flowchart.

Step 3: You can add text within every shape to add more clarity to your flowchart.

Step 4: You can also add more color, edit text, change color, and explore many other options to make decision making easier in your flowchart on Excel.

Best Free Alternative to Microsoft Excel - WPS Office
Millions of people want to learn how to create a flowchart in Excel. Everyone can agree that it can be a complicated and often frustrating task. You can save yourself from getting frustrated by using WPS Office; a perfect alternative to Microsoft Excel.
WPS Office offers a free version with the most essential features. It maintains full compatibility with Microsoft Excel features, formulas, and macros. Among many outstanding features, the best part about WPS Office is that it is free to download.
In addition, people find WPS Office and its tools very easy to use. You do not need any prior experience to excel at creating a flowchart on the WPS Office. It does not take long for one to master the art.


FAQs
Here are the answers to some of the most frequently asked questions about flowcharts and Excel.
1. Can I add hyperlinks to flowchart shapes?
It is very simple to add hyperlinks to your flowchart. Hyperlinks in a flowchart can help the readers to look further into the context of your flowchart and learn more along the way. Here is how you can add hyperlinks to your flowchart in Excel.
Step 1: Select the Shape that you want to add a hyperlink to.
Step 2: Click the insert tab and go to the link option from the top ribbon.
Step 3: Type or Copy and paste the address that you want to add in the hyperlink.
2. How do I make my flowchart interactive?
Many people think that flowcharts can become a bit boring or overwhelming to view sometimes. You can make your flowcharts interactive in many ways such as adding hyperlinks, using VBA Macros, adding comments, and adding colors to the shapes.
Interactive flowcharts can help you convey processes to the readers without a hassle. They can create a lot more effective outcomes as compared to other flowcharts in Excel.
3. Is it possible to automate flow chart generation in Excel?
You can automate how to create a flowchart on Excel by using VBA macros. This function can use predefined data to create a flowchart. You can determine the rules or conditions for generating the flowchart and write a VBA macro to analyze the data and generate the flowchart structure.
The macro may involve looping through the data, making decisions, and adding shapes, connectors, and text labels dynamically based on the rules or conditions. You can format the generated flowchart elements to make the flowchart visually appealing and easy to understand.
4. How can I convert a mind map into a presentation from Excel?
While Excel specializes in flowcharts, you can easily transform mind map to presentation. Export your Excel flowchart as an image (PNG/SVG), then drag it into WPS slides. For native mind maps, use WPS's "Insert Object" feature to embed editable maps and animate branches step-by-step – ideal for brainstorming sessions.
The Best Alternative to Create a Flowchart in Excel – WPS Office
This article discusses the complete process of how to create a flowchart in Excel and users understand that it is not an easy task. You may want to look into better alternatives such as WPS Office to make your life easier.
WPS Office is a free and best alternative to streamline your productivity and cut down on the complexities of learning how to create a flowchart in Excel. It is compatible on all operating systems such as Linux, iOS, Android, Windows, and much more.
You can head to wps.com today and download a free version for your device. You can also purchase the premium version to gain full access to the added features.

'%3e%3cpath%20d='M19.9911%204.11386V6.471H18.5894C18.0775%206.471%2017.7322%206.57814%2017.5536%206.79243C17.3751%207.00671%2017.2858%207.32814%2017.2858%207.75671V9.44421H19.9019L19.5536%2012.0871H17.2858V18.8639H14.5536V12.0871H12.2769V9.44421H14.5536V7.49779C14.5536%206.39064%2014.8632%205.53201%2015.4822%204.92189C16.1013%204.31177%2016.9257%204.00671%2017.9554%204.00671C18.8304%204.00671%2019.509%204.04243%2019.9911%204.11386Z'%20fill='%23333333'/%3e%3c/g%3e%3cdefs%3e%3cclipPath%20id='clip0_2938_8199'%3e%3crect%20width='16'%20height='16'%20fill='white'%20transform='translate(8%204.00671)'/%3e%3c/clipPath%3e%3c/defs%3e%3c/svg%3e)
'%3e%3cpath%20d='M17.5237%2010.7813L23.4811%204H22.0699L16.8949%209.88693L12.7648%204H8L14.2469%2012.9029L8%2020.0133H9.4112L14.8725%2013.7952L19.2352%2020.0133H24M9.92053%205.04213H12.0885L22.0688%2019.0224H19.9003'%20fill='%23333333'/%3e%3c/g%3e%3cdefs%3e%3cclipPath%20id='clip0_2938_8200'%3e%3crect%20width='16'%20height='16.0134'%20fill='white'%20transform='translate(8%204)'/%3e%3c/clipPath%3e%3c/defs%3e%3c/svg%3e)


