WPS Office

Free All-in-One Office Suite with PDF Editor

correct-icon

Edit Word, Excel, and PPT for FREE.

correct-icon

Read, edit, and convert PDFs with the powerful PDF toolkit.

correct-icon

Microsoft-like interface, easy to use.

Free download

Windows • MacOS • Linux • iOS • Android

banner

Best 10 excel dashboard examples in free excel 2022

August 29, 2022
4.2K Views

Excel helps in working smartly and quickly due to its many tools. It helps management to decide by tracking data points for comparing, KPIs, and having data-backed views. Dashboard examples in excel are very necessary to have a look at.

In this article, you will be learning how to create dashboard examples in excel quickly and its examples. We will be providing you with smart practices to follow when you have to create it. Furthermore, the tools and features which you will be using in excel software, what you should avoid and hence, we will be recommending you instructional materials.

Creative Sales Statistics Sheet

This Statistics sheet is designed to provide you to analyze and insert multiple operations in your data. It is comprised of both charts and tables. It is used to contrast the current year's sale and the previous one.

Colorful General Analysis Chart

This excel dashboard template is created to analyze and contrast data using different charts. It helps you indicate each month or the data you have with a different color. It also helps in making your excel sheet more noticeable.

Store October Merchandise Sale Monthly Report

This dashboard excel template will let a business gather the sales they have made in a month. As it comprises all the details and information required for a general business. It will help the business in keeping track of sales and analyze it further by using a Bar chart.

Construction Schedule Gantt Chart

This template will help keep track of projects. It will further show the project's progress with the use of a Gantt chart and every color will indicate the progress of the project since the first day.

Sales Performance Report

This excel dashboard is very smart to represent and analyze the sales that have been made throughout the year. It can be used by the sales representative to represent. the sales made by the company and they can further represent their progress in the form of multiple charts.

Annual Analysis Summary Report of Sales

This template is designed to analyze and contrast the sales of the company made by the sales worker individually. As the template consists of monthly, routine, and personal analyses along with charts. So, it will ave company to acknowledge there best sales man.

Product Development Schedule

This excel template is designed to help a company in developing of product. As it is comprised of a schedule format which will be used to show you the progress made in the development along with its timeline.

Final Half Year Financial Income Expenditure Summary

This excel dashboard will be useful for an employee to calculate expenditures, income, and the output generated from it in a company. It will calculate and analyze the record made quarterly.

Cash Flow Table

This excel template will be handy for the accounts department. It Is used to input the project details and the material which has been recapitalized and hence summing the total amount generated from it.

Application Form for Procurement

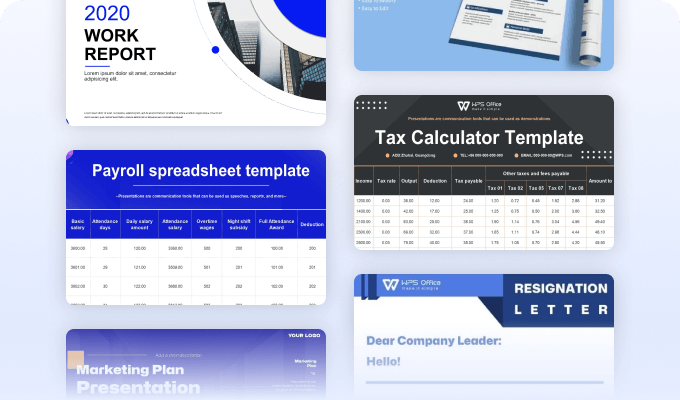
The template is designed to accommodate a company's work efficiently. It is used by the department of production in which they can request the material they require to acquire the finished goods.So, We hope that you have find these dashboard examples in excel templates helpful. They can be used in many ways possible. Download WPS Office now to gain access to thousands of different templates that can make your life easier.                                

15 years of office industry experience, tech lover and copywriter. Follow me for product reviews, comparisons, and recommendations for new apps and software.