
'%3e%3cpath%20d='M8%200C12.4183%200%2016%203.58172%2016%208C16%2012.4183%2012.4183%2016%208%2016C3.58172%2016%200%2012.4183%200%208C0%203.58172%203.58172%200%208%200ZM11.6162%204.38379C11.2257%203.99337%2010.5927%203.99338%2010.2021%204.38379L8%206.58594L5.79785%204.38379C5.40732%203.99334%204.77429%203.99329%204.38379%204.38379C3.99331%204.77429%203.99335%205.40733%204.38379%205.79785L6.58594%208L4.38379%2010.2021C3.99348%2010.5927%203.99341%2011.2257%204.38379%2011.6162C4.77426%2012.0066%205.40734%2012.0065%205.79785%2011.6162L8%209.41406L10.2021%2011.6162C10.5927%2012.0066%2011.2257%2012.0067%2011.6162%2011.6162C12.0067%2011.2257%2012.0066%2010.5927%2011.6162%2010.2021L9.41406%208L11.6162%205.79785C12.0066%205.40735%2012.0066%204.77429%2011.6162%204.38379Z'%20fill='%23080E17'%20fill-opacity='0.46'/%3e%3c/g%3e%3cdefs%3e%3cclipPath%20id='clip0_3761_713'%3e%3crect%20width='16'%20height='16'%20fill='white'/%3e%3c/clipPath%3e%3c/defs%3e%3c/svg%3e)


'%3e%3cpath%20fill-rule='evenodd'%20clip-rule='evenodd'%20d='M21.4999%2010.9993C21.4999%205.20009%2016.7986%200.498901%2010.9993%200.498901C5.19994%200.498901%200.498657%205.20009%200.498657%2010.9993C0.498657%2016.2404%204.33858%2020.5844%209.35855%2021.3722V14.0346H6.69238V10.9993H9.35855V8.68594C9.35855%206.05427%2010.9262%204.60062%2013.3248%204.60062C14.4736%204.60062%2015.6753%204.80571%2015.6753%204.80571V7.38979H14.3512C13.0468%207.38979%2012.64%208.19921%2012.64%209.0296V10.9993H15.5523L15.0867%2014.0346H12.64V21.3722C17.66%2020.5844%2021.4999%2016.2404%2021.4999%2010.9993Z'%20fill='%231568EA'/%3e%3c/g%3e%3c/svg%3e)


Venn diagrams are a simple and effective way to visually compare and contrast concepts, ideas, or data. They're commonly used in education, business, and research to help people understand complex relationships. However, creating a Venn diagram in PowerPoint can be tricky, especially if you're not familiar with the software. In this guide, I'll show you three easy ways to make a Venn diagram in PowerPoint, even if you're a beginner.
What Is a Venn Diagram in PowerPoint?
1. Different forms of venn diagrams in PowerPoint
A Venn diagram in PowerPoint is a visual representation of the relationships between two or more sets of data. It uses overlapping circles to illustrate what elements belong to each set and which ones are on several sets at the same time. This way, you can easily compare and contrast the similarities and differences of things or groups of things.
Different forms of Venn diagrams in PowerPoint:
PowerPoint offers a variety of Venn diagram layouts, including:
● Basic Venn diagram: This layout uses two overlapping circles to represent two sets of data.

● Triple Venn diagram: This layout uses three overlapping circles to represent three sets of data.

● Linear Venn diagram: This layout uses multiple overlapping circles to represent a sequence of sets of data.

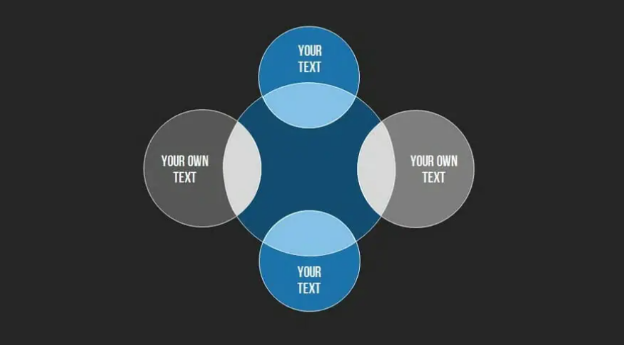
● Stacked Venn diagram: This layout uses multiple overlapping circles to represent the relationship between a central set of data and other sets of data.

● Radial Venn diagram: This layout uses multiple overlapping circles to represent the relationship between a central set of data and other sets of data, with an emphasis on growth or gradation.
2. Benefits of using venn diagram in PowerPoint
Venn diagrams are a powerful tool for visually comparing and contrasting two or more sets of data. They are easy to understand and can be used to communicate complex relationships in a clear and concise way.
Venn diagrams are especially useful for PowerPoint presentations because they can help to:
● Engage the audience: Venn diagrams are visually appealing and can help to capture the audience's attention.
● Simplify complex information: Venn diagrams can help to make complex information easier to understand by breaking it down into smaller, more manageable chunks.
● Identify relationships: Venn diagrams can help to identify the relationships between different sets of data, such as similarities, differences, and overlaps.
● Support your argument: Venn diagrams can be used to support your argument by providing visual evidence of your points.
Here are some examples of how Venn diagrams can be used in real-life PowerPoint presentations:
● A marketing manager could use a Venn diagram to compare and contrast the features of two different products.
● A sales representative could use a Venn diagram to show the similarities and differences between the needs of two different customer segments.
● A teacher could use a Venn diagram to illustrate the relationship between different concepts in a science or math lesson.
● A researcher could use a Venn diagram to visualize data from a survey or study.
Overall, Venn diagrams are a valuable tool for creating clear, informative, and engaging PowerPoint presentations.
Method1: Download Free Venn Diagram PowerPoint Templates Online
Please follow these steps:
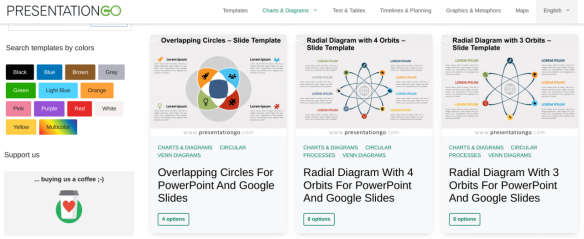
Step 1: Go to the website, select the templates that suit your need
There are many websites that offer free Venn diagram PowerPoint templates, such asPresentationGo.
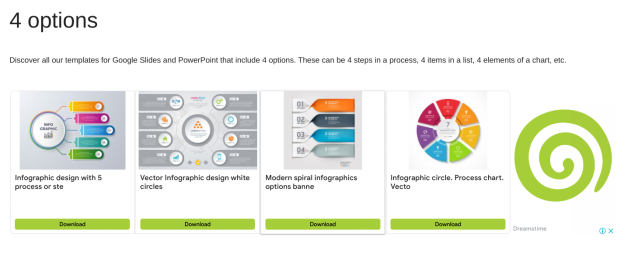
Step 2: Download the templates for free
Once you have found a template that you like, click on it to open the preview page. Then, click on the Download button to download the template for free.
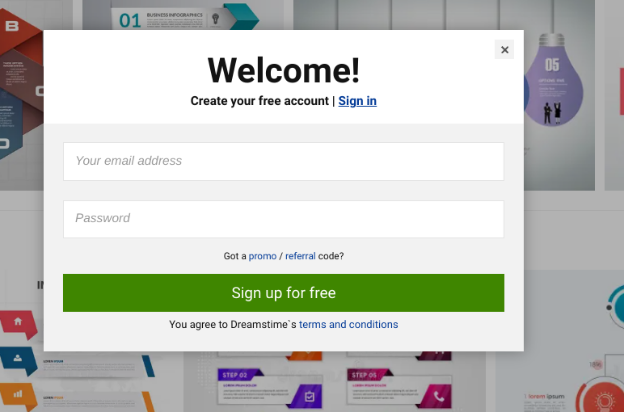
Step 3: Sign up to download the template
Step 4: Open the .pptx file and customize
Open the downloaded .pptx file in PowerPoint.
Customize the template to fit your needs. You can change the text, colors, fonts, and formatting and add your own content to the diagram.

Once you are finished customizing the Venn diagram, you can save it and use it in your presentation.
Comment: Downloading templates is a quick and easy way to get started, especially if you're short on time.
Method2: Use Free Online Venn Diagram Generator
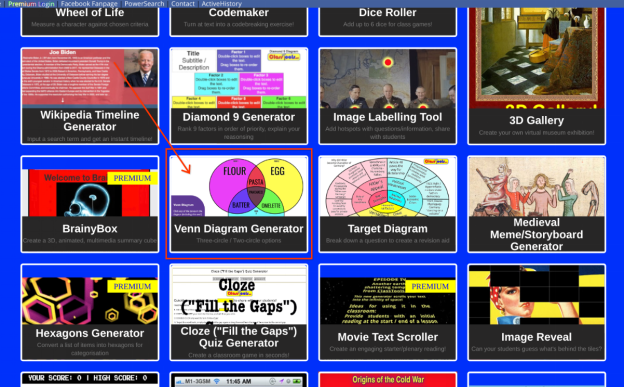
There are many free online Venn diagram generators available. One popular option is ClassTools.net. To get started, please follow these steps:
Step 1: Go to theClassTools.net website and go to the Venn Diagrams page.
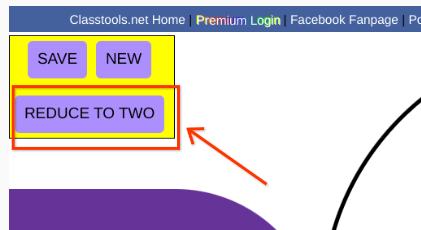
Step 2: Create your Venn diagram
Select the number of circles you want to use by clicking on the button
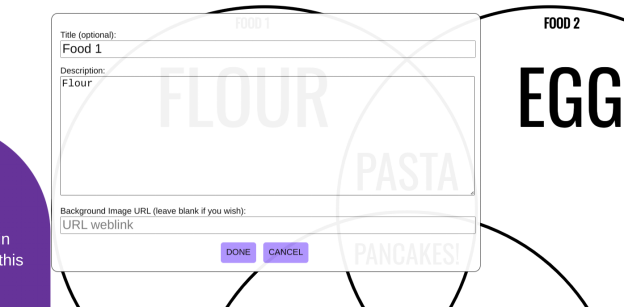
Step 3: Add text and customize your Venn diagram
You can start adding text and customizing your Venn diagram. To add text to a circle, simply click on the circle and start typing. You can also add images, shapes, and other elements to your Venn diagram.
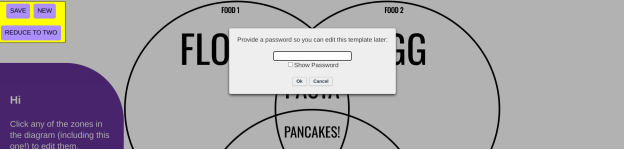
Step 4: Save your Venn diagram
Click on the Save button, name the title then enter your password and click OK
Comment: Online generators are user-friendly and efficient, but they may have limitations in terms of customization. Great for quick and simple diagrams.
Method3: Create a Venn Diagram in PowerPoint Manually
Creating a Venn Diagram in PowerPoint manually can be a visually engaging way to represent data and concepts. Here's a step-by-step guide with screenshots to help you do this:
Step 1: Open PowerPoint and create a new slide
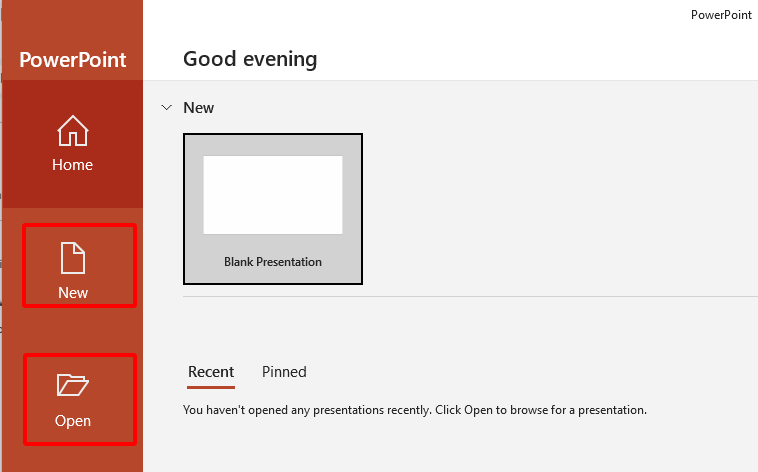
Step 2: Insert Shapes
Click on the "Shapes" button in the PowerPoint toolbar, and then select "Circle" to create the first circle for your Venn Diagram. You can adjust the size and position by dragging and resizing the circle.

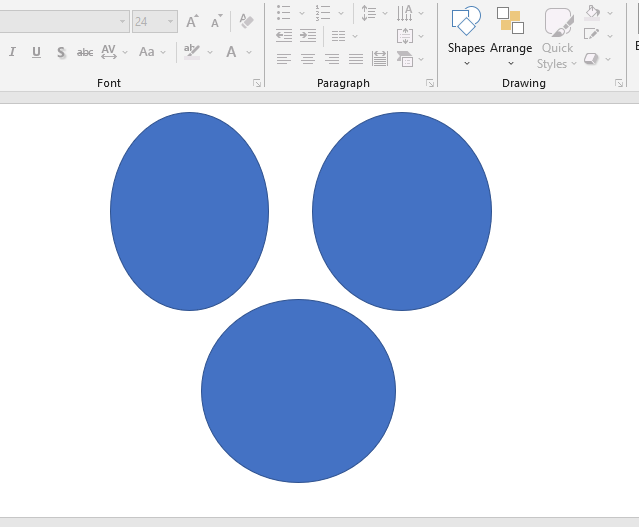
Step 3: Insert More Circles. Position and size them as needed.
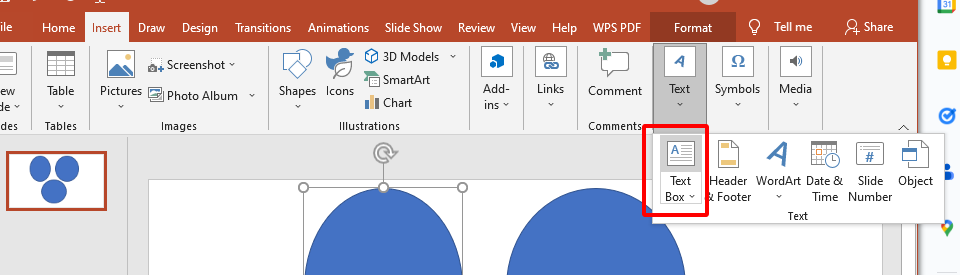
Step 4: Add Text
Click on the "Text Box" tool in the PowerPoint toolbar and add text labels to each circle to represent the different sets or categories.
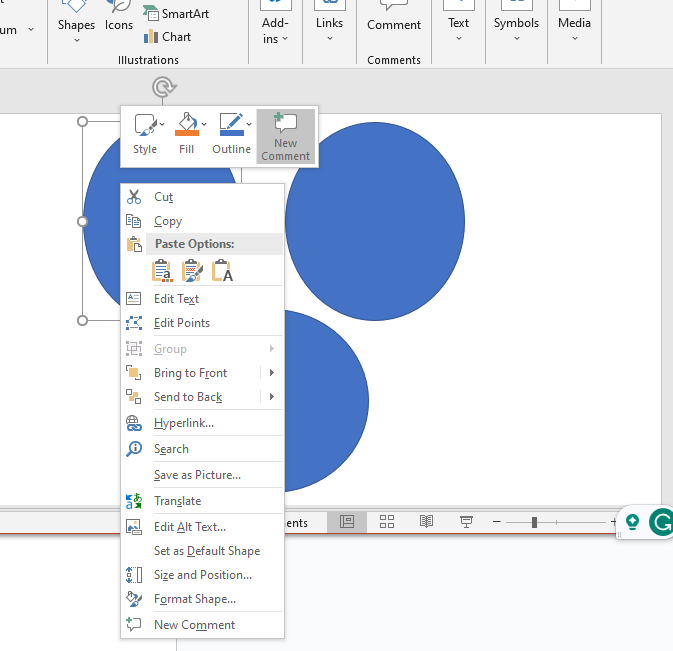
Step 5: Customize your Venn Diagram
You can format the circles, change their colors, and add borders
Step 6: Add Data and Overlapping Areas
To represent data in your Venn Diagram, you can change the color or shading of specific sections to indicate overlaps or distinctions between sets.
Don't forget to save your PowerPoint presentation so you can access it later or share it with others. Once you're satisfied, you can present your diagram in your PowerPoint slideshow.
Comparison and Conclusion:
Method 1 (Downloading Templates) is suitable when you need pre-designed, professionally crafted Venn Diagram templates. It's a great choice for quick and easy solutions, especially when you want polished visuals without spending much time on design.
Method 2 (Online Generator) is ideal when you need a basic Venn Diagram quickly and don't want to download any files. It's user-friendly but may lack advanced customization options.
Choose Method 1 when you want convenience, aesthetics, and professionally designed templates. Use Method 2 when you need a straightforward, no-download-required, and basic Venn Diagram, especially for educational or simple visualizations.
How to Make Venn Diagram for Free with WPS Office
1. What Is WPS Office
Microsoft Office has been the market leader in office productivity software for decades, offering robust applications such as Word, Excel, and PowerPoint. However, with the rise of cloud-based solutions and the increasing demand for cost-effective options, free alternatives like WPS Office have gained popularity.
Why should you choose WPS Office as an alternative to Microsoft Office?
Here are the answer:
● Free to use Word, Excel, and PPT. Powerful PDF toolkit
● Rich template store, which contains variousfree and paid templates for Word, PPT, and Excel
● Rich functions
● The light weight of the product is only 200M, and it occupies a small amount of computer memory. It is suitable for Win7, 10, and 11
● The MAC version of WPS Office is very powerful. Microsoft office ignores the experience of mac users, which can be made up by wps office
● Supportonline documents (WPS AirPage), multi-person collaborative editing
● WPS office also supports Linux systems, Android, and ios systems. To use WPS office products on different systems, you only need to log in to the same account, and all files can be synchronized
2. How to Create a Customizable Venn Diagram in WPS Office


FAQs
1. How do you make a Venn diagram overlapping in PowerPoint?
Use a third-party Venn diagram generator:
There are many third-party Venn diagram generators available online. Choose a generator that you like and create your Venn diagram.
Once you have created your Venn diagram, download it to your computer.
Insert the Venn diagram into your PowerPoint slide by going to the Insert tab and clicking on the Picture button.
2. How do I copy and paste a diagram in PowerPoint from the web?
To copy and paste a diagram in PowerPoint from the web, follow these steps:
● Open the web page that contains the diagram that you want to copy.
● Right-click on the diagram and select Copy image.
● Open PowerPoint and go to the slide where you want to paste the diagram.
● Right-click on the slide and select Paste.
3. How do I save my Venn diagram as a template?
To save your Venn diagram as a template, go to the File tab and click on Save as Template. In the Save As Template dialog box, give your template a name and select the location where you want to save it. Click Save to save the template.
Summary
The article "3 Easy Ways to Make a Venn Diagram in PowerPoint (The Beginner’s Guide)" discusses three methods to create Venn Diagrams in PowerPoint, all centered on slide object. It emphasizes the use of WPS Office as a versatile tool for this purpose.
The guide also provides step-by-step instructions with screenshots for each method, making it accessible for beginners. Readers can choose the method that best suits their needs and level of customization, with WPS Office being a valuable tool for these diagram creation tasks.

'%3e%3cpath%20d='M19.9911%204.11386V6.471H18.5894C18.0775%206.471%2017.7322%206.57814%2017.5536%206.79243C17.3751%207.00671%2017.2858%207.32814%2017.2858%207.75671V9.44421H19.9019L19.5536%2012.0871H17.2858V18.8639H14.5536V12.0871H12.2769V9.44421H14.5536V7.49779C14.5536%206.39064%2014.8632%205.53201%2015.4822%204.92189C16.1013%204.31177%2016.9257%204.00671%2017.9554%204.00671C18.8304%204.00671%2019.509%204.04243%2019.9911%204.11386Z'%20fill='%23333333'/%3e%3c/g%3e%3cdefs%3e%3cclipPath%20id='clip0_2938_8199'%3e%3crect%20width='16'%20height='16'%20fill='white'%20transform='translate(8%204.00671)'/%3e%3c/clipPath%3e%3c/defs%3e%3c/svg%3e)
'%3e%3cpath%20d='M17.5237%2010.7813L23.4811%204H22.0699L16.8949%209.88693L12.7648%204H8L14.2469%2012.9029L8%2020.0133H9.4112L14.8725%2013.7952L19.2352%2020.0133H24M9.92053%205.04213H12.0885L22.0688%2019.0224H19.9003'%20fill='%23333333'/%3e%3c/g%3e%3cdefs%3e%3cclipPath%20id='clip0_2938_8200'%3e%3crect%20width='16'%20height='16.0134'%20fill='white'%20transform='translate(8%204)'/%3e%3c/clipPath%3e%3c/defs%3e%3c/svg%3e)


