
'%3e%3cpath%20d='M8%200C12.4183%200%2016%203.58172%2016%208C16%2012.4183%2012.4183%2016%208%2016C3.58172%2016%200%2012.4183%200%208C0%203.58172%203.58172%200%208%200ZM11.6162%204.38379C11.2257%203.99337%2010.5927%203.99338%2010.2021%204.38379L8%206.58594L5.79785%204.38379C5.40732%203.99334%204.77429%203.99329%204.38379%204.38379C3.99331%204.77429%203.99335%205.40733%204.38379%205.79785L6.58594%208L4.38379%2010.2021C3.99348%2010.5927%203.99341%2011.2257%204.38379%2011.6162C4.77426%2012.0066%205.40734%2012.0065%205.79785%2011.6162L8%209.41406L10.2021%2011.6162C10.5927%2012.0066%2011.2257%2012.0067%2011.6162%2011.6162C12.0067%2011.2257%2012.0066%2010.5927%2011.6162%2010.2021L9.41406%208L11.6162%205.79785C12.0066%205.40735%2012.0066%204.77429%2011.6162%204.38379Z'%20fill='%23080E17'%20fill-opacity='0.46'/%3e%3c/g%3e%3cdefs%3e%3cclipPath%20id='clip0_3761_713'%3e%3crect%20width='16'%20height='16'%20fill='white'/%3e%3c/clipPath%3e%3c/defs%3e%3c/svg%3e)


'%3e%3cpath%20fill-rule='evenodd'%20clip-rule='evenodd'%20d='M21.4999%2010.9993C21.4999%205.20009%2016.7986%200.498901%2010.9993%200.498901C5.19994%200.498901%200.498657%205.20009%200.498657%2010.9993C0.498657%2016.2404%204.33858%2020.5844%209.35855%2021.3722V14.0346H6.69238V10.9993H9.35855V8.68594C9.35855%206.05427%2010.9262%204.60062%2013.3248%204.60062C14.4736%204.60062%2015.6753%204.80571%2015.6753%204.80571V7.38979H14.3512C13.0468%207.38979%2012.64%208.19921%2012.64%209.0296V10.9993H15.5523L15.0867%2014.0346H12.64V21.3722C17.66%2020.5844%2021.4999%2016.2404%2021.4999%2010.9993Z'%20fill='%231568EA'/%3e%3c/g%3e%3c/svg%3e)


Line graphs provide a clear method for illustrating trends over a period. In Excel, this process is particularly straightforward. Whether you're a medical professional, scientist, or finance expert, Excel's line graph feature simplifies the task of tracking trends. In this article, we will guide you through the steps on how to Create a Line Graph in Excel for various applications.
What is the Line Graph in Excel?
A Line Graph in Excel is a visual tool that helps display the relationship between two variables, making it easier to identify trends. For instance, if you have a set of years on one axis and the other axis, you have the number of sales, the line graph can illustrate whether there's a rise, fall, or some other trend between these two variables. This visual representation assists professionals in analyzing data more effectively.

How to Create a Line Graph in Excel?
Line graphs in Excel are a great way to show how data changes over time. They can help you present, analyze, and visualize your data in a clear and simple way. You can use line graphs to show trends, patterns, or relationships in your data sets. But how do you make a line graph in Excel? In this section, we will show you how to create a line graph in Excel with one or more lines. Follow these steps to create your line graph in Excel.
A line graph:
A single-line graph is a kind of chart that shows how two variables are related. One variable is depicted on the horizontal axis, while the other is depicted on the vertical axis. A single-line graph can help you see how a variable changes over time or how it compares to another variable. In our example, we will use a data set that shows the daily temperature readings (in degrees Celsius) over a 10-day period to create a single-line graph in Excel. This will help us see how the temperature varied during this period.

Step 1: Select the data that you want to show in the line graph.
Step 2: Go to the “Insert” tab and click on the “Line Graph” icon in the “Charts” section of the ribbon menu.

Step 3: From the “Line Graph” menu, choose “Line”.

You have now created a line graph in Excel that shows the relationship between Date and Temperature. You can use this graph to see how the temperature changed over time and get better insights.
Plot Multiple lines:
A line graph in Excel with 2/3 variables can help you compare how different variables change over time or in relation to one variable. For example, you can use a line graph with multiple variables to compare the temperature trends of different cities over the months. In this section, we will show you how to create a line graph within Excel with 2/3 variables using the following example:
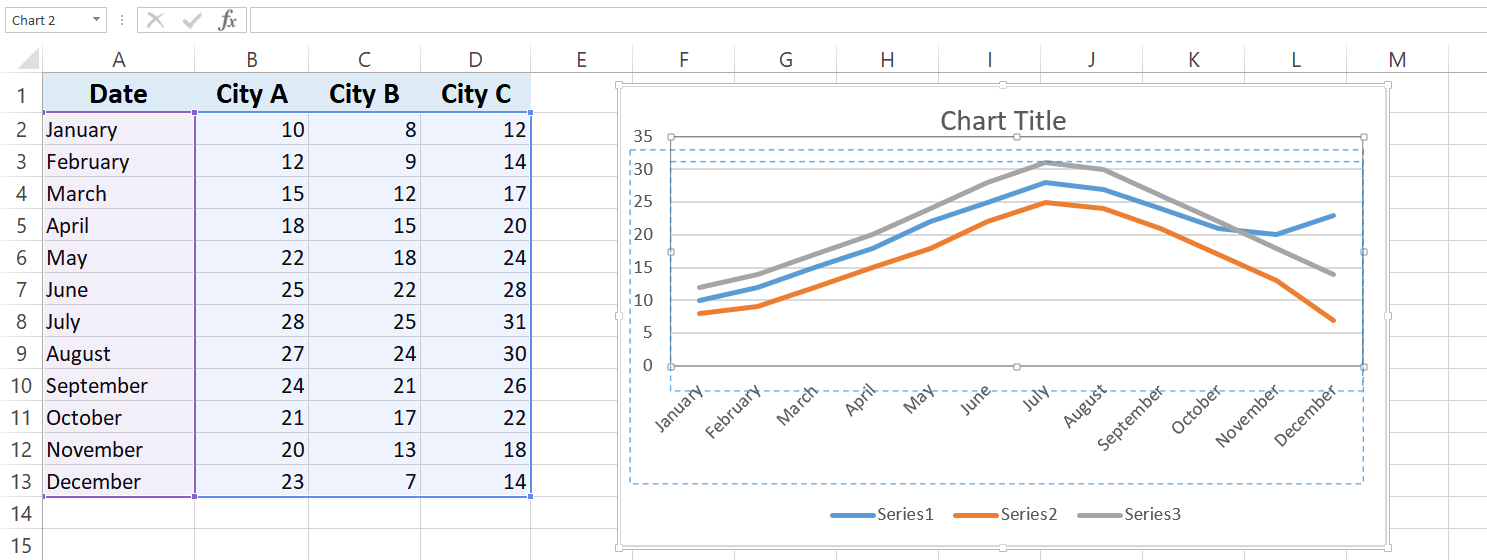
The following data set shows the average temperatures of City A, City B, and City C over the months. This will allow us to see how the temperatures of the three cities vary throughout the year.

Step 1: Select the dataset containing all the variables intended for the line graph.
Step 2: Navigate to the "Insert" tab, and in the "Charts" section, click on "Line Graph"

Step 3: From the options, choose "Line" under 2-D graphs.

You have now created a line graph with multiple lines. You can use this graph to compare the temperature trends of the three cities. Observe temperature disparities and gain insights into the comparative weather conditions of each city.

How to Customize Your Line Graph in Excel
Customizing the Graph
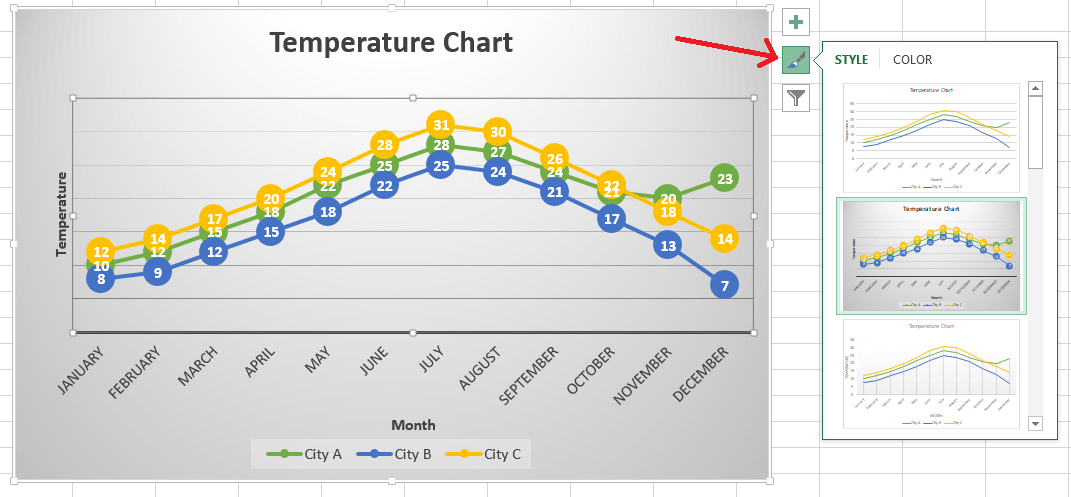
1. Alter the style:
Effortlessly modify your chart's style using the Brush icon atop the line graph. A simple click on any style within the "Styles" section will instantly transform your line chart's appearance. To further tailor it, explore the "Color" tab for changing line colors.
2. Rearrange your graph:
To change the position of your graph, click and drag the white space near the top of the graph to move it. You can also move specific parts of the graph (e.g., the title) by clicking and dragging them inside the graph window.
3. Title transformation:
To rename your graph, double-click on the title of the graph, then select the “Chart Title” text and type in your new name. Click anywhere outside of the title box to save it.

To add labels to your graph’s axes, follow these steps:
Step 1: Click on the graph and then click on “+” on the right side of the graph. A menu will pop up.

Step 2: Check the box for Axis Titles.

Step 3: Double-click on the Axis Title box and delete the default text. Type in a new label.

4. Edit Legends:
Step 1: Begin by choosing your graph and right-clicking to access the context menu.
Step 2: Proceed to "Select Data" from the options presented.

Step 3: To edit the Series name, select "Series 1", and then click on "Edit"

Step 4: In the "Series Name" field, input "City A" and confirm with "OK".

Step 5: Apply the same process for City B and City C. Confirm each with "OK".

By following these steps, your Legends will be accurately updated.

5. Quick Chart Layouts:
For swift line chart layout adjustments, navigate to the "Format" tab and find "Quick Layout" in the ribbon menu. This facilitates the ideal presentation of your line graph, tailored to your information delivery.

6. Using Format Data Series
Format Data Series can be used to customize the line graph in a variety of ways. To access Format Data Series, simply select any of the lines from the graph, right-click to open the context menu, and select “Format Data Series”. Using this, users can opt to:
Have smoothed lines
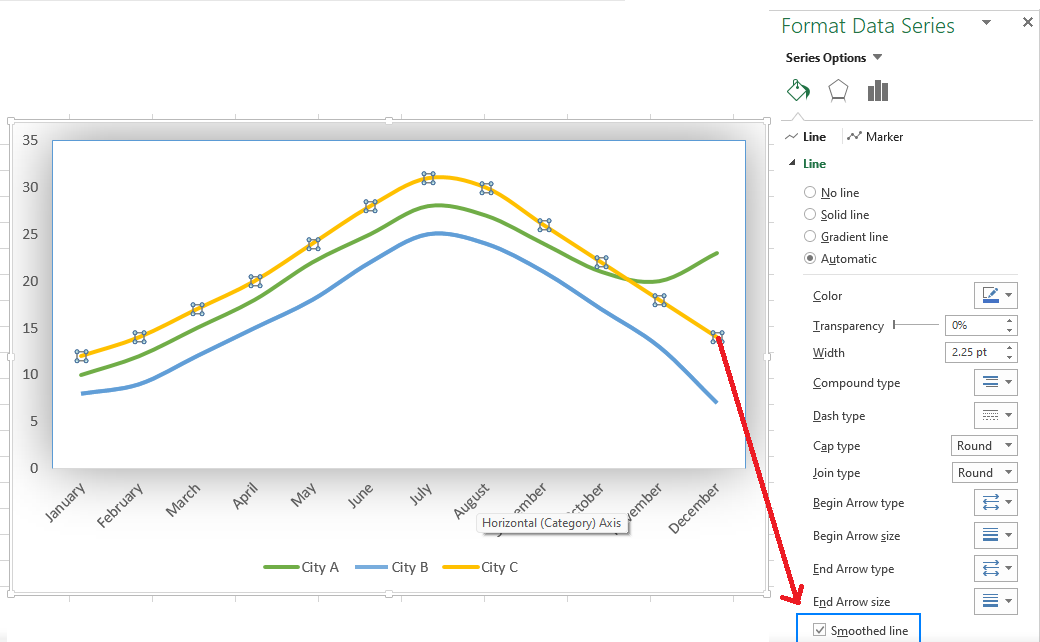
Fade out the line graph

Change the line type

Tips:
Use Consistent Intervals: Maintain consistent intervals on both axes to avoid distorting the data and making it easier to interpret.
Keep it Neat: A clutter-free graph is more visually appealing and easier to understand. Remove unnecessary elements if they don't contribute to the message.
Limit the number of lines: Restrict the number of lines to 3-4 when crafting a multiple-line chart. This practice prevents the graph from becoming cluttered and ensures ease of interpretation.
A Free Alternative to Microsoft Office——WPS Office
WPS Office stands out as a comprehensive office suite that brings together a full range of essential tools, effectively serving as an all-in-one solution. This suite includes applications such as Writer for text documents, Presentation for slides, Spreadsheet for data management, and a PDF editing tool. It's remarkable how WPS Office combines these essential functions into one package.

With WPS Office, you get access to an array of advanced features that cater to various productivity needs. What's more, the suite integrates AI capabilities, further enhancing its functionality. What sets it apart is the fact that all these features come completely free of charge. It might sound too good to be true, but it's indeed the reality. Whether you're working on documents, presentations, spreadsheets, or PDFs, WPS Office has you covered, providing a versatile and efficient platform for your office needs.

FAQs
Q1. How to update data in the previous line chart?
To update data in a previous line chart, select the chart, go to "Design" or "Chart Tools," choose "Select Data," modify existing series or add new ones, and click "OK" to update the chart with the new data.
Q2. How to smooth the angles of the line chart?
To enhance the appearance of a line chart by smoothing out its angles:
Step 1: Double-click on the desired line
Step 2: Navigate to the Fill and Line tab in the “Format Data Series” pane.
Step 3: Select the "Smoothed Line" checkbox.
Mastering Line Graphs for Effective Data Visualization
A line graph offers an accurate depiction of the relationship between two variables. Having learned how to create a line graph in Excel through this article, you can now take your skills a step further. Consider downloading the WPS Spreadsheet, where the process takes just a matter of minutes. Stay tuned for the integrated AI, which will eventually simplify the job even more.

'%3e%3cpath%20d='M19.9911%204.11386V6.471H18.5894C18.0775%206.471%2017.7322%206.57814%2017.5536%206.79243C17.3751%207.00671%2017.2858%207.32814%2017.2858%207.75671V9.44421H19.9019L19.5536%2012.0871H17.2858V18.8639H14.5536V12.0871H12.2769V9.44421H14.5536V7.49779C14.5536%206.39064%2014.8632%205.53201%2015.4822%204.92189C16.1013%204.31177%2016.9257%204.00671%2017.9554%204.00671C18.8304%204.00671%2019.509%204.04243%2019.9911%204.11386Z'%20fill='%23333333'/%3e%3c/g%3e%3cdefs%3e%3cclipPath%20id='clip0_2938_8199'%3e%3crect%20width='16'%20height='16'%20fill='white'%20transform='translate(8%204.00671)'/%3e%3c/clipPath%3e%3c/defs%3e%3c/svg%3e)
'%3e%3cpath%20d='M17.5237%2010.7813L23.4811%204H22.0699L16.8949%209.88693L12.7648%204H8L14.2469%2012.9029L8%2020.0133H9.4112L14.8725%2013.7952L19.2352%2020.0133H24M9.92053%205.04213H12.0885L22.0688%2019.0224H19.9003'%20fill='%23333333'/%3e%3c/g%3e%3cdefs%3e%3cclipPath%20id='clip0_2938_8200'%3e%3crect%20width='16'%20height='16.0134'%20fill='white'%20transform='translate(8%204)'/%3e%3c/clipPath%3e%3c/defs%3e%3c/svg%3e)


