
'%3e%3cpath%20d='M8%200C12.4183%200%2016%203.58172%2016%208C16%2012.4183%2012.4183%2016%208%2016C3.58172%2016%200%2012.4183%200%208C0%203.58172%203.58172%200%208%200ZM11.6162%204.38379C11.2257%203.99337%2010.5927%203.99338%2010.2021%204.38379L8%206.58594L5.79785%204.38379C5.40732%203.99334%204.77429%203.99329%204.38379%204.38379C3.99331%204.77429%203.99335%205.40733%204.38379%205.79785L6.58594%208L4.38379%2010.2021C3.99348%2010.5927%203.99341%2011.2257%204.38379%2011.6162C4.77426%2012.0066%205.40734%2012.0065%205.79785%2011.6162L8%209.41406L10.2021%2011.6162C10.5927%2012.0066%2011.2257%2012.0067%2011.6162%2011.6162C12.0067%2011.2257%2012.0066%2010.5927%2011.6162%2010.2021L9.41406%208L11.6162%205.79785C12.0066%205.40735%2012.0066%204.77429%2011.6162%204.38379Z'%20fill='%23080E17'%20fill-opacity='0.46'/%3e%3c/g%3e%3cdefs%3e%3cclipPath%20id='clip0_3761_713'%3e%3crect%20width='16'%20height='16'%20fill='white'/%3e%3c/clipPath%3e%3c/defs%3e%3c/svg%3e)


'%3e%3cpath%20fill-rule='evenodd'%20clip-rule='evenodd'%20d='M21.4999%2010.9993C21.4999%205.20009%2016.7986%200.498901%2010.9993%200.498901C5.19994%200.498901%200.498657%205.20009%200.498657%2010.9993C0.498657%2016.2404%204.33858%2020.5844%209.35855%2021.3722V14.0346H6.69238V10.9993H9.35855V8.68594C9.35855%206.05427%2010.9262%204.60062%2013.3248%204.60062C14.4736%204.60062%2015.6753%204.80571%2015.6753%204.80571V7.38979H14.3512C13.0468%207.38979%2012.64%208.19921%2012.64%209.0296V10.9993H15.5523L15.0867%2014.0346H12.64V21.3722C17.66%2020.5844%2021.4999%2016.2404%2021.4999%2010.9993Z'%20fill='%231568EA'/%3e%3c/g%3e%3c/svg%3e)


Planning itineraries and achieving clear goals are essential for optimizing work efficiency.
However, many individuals need help creating effective flowcharts and accessing suitable templates. This article provides a solution by offering step-by-step instructions and introducing ten professional WPS PowerPoint templates. By answering how to create a flowchart, readers can enhance their itinerary planning, achieve their objectives efficiently, and improve productivity.
The role of a flowchart
A flowchart is the perfect way to visualize a complex process for your team. There are over 30 standardized symbols you can use to create a flowchart. These symbols can indicate anything from an approach to a document or decisions that must be made. The role of a flowchart in visualizing complex processes must be considered.
It is a powerful tool that allows you to present information clearly and structured. That enables your team to understand and follow a process more efficiently and effectively. Using standardized symbols, you can create a flowchart that represents various process elements, such as documents, decisions, activities, and more.
These symbols act as visual cues, making it easier for team members to grasp the flow and logic of the depicted process.
When creating a flowchart, it's essential to consider its purpose and target audience. Are you aiming to design a new workflow, document an existing process, or analyze a problem? Understanding the goal will help you determine the complexity and detail required in your flowchart.
What is included in the flowchart
Start and end points (circles)
In a flowchart, start and circles or rounded rectangles represent endpoints. The start point indicates the beginning of the process. The endpoint marks the outcome or completion. These symbols help establish the boundaries of the depicted process and provide a clear visual indication of where the flowchart starts and finishes.
Decision points (diamonds)
Diamond-shaped symbols represent decision points in a flowchart. They signify a point in the process where a decision needs to be made. Typically, a question is written inside the diamond to specify the decision that needs to be taken. The flow of the process then changes based on the outcome of the decision, with arrows leading to the appropriate following actions or steps.
Abstract or detailed description of units of work (rectangles)
Rectangles are commonly used in flowcharts to represent the various steps or activities involved in a process. These rectangles can contain detailed or abstract descriptions of the work units being performed. Detailed reports offer more specific information about the task or action. Abstract descriptions, on the other hand, provide a high-level overview of the activity. Each rectangle represents a distinct step in the process and is connected to other efforts through arrows to indicate the sequence or flow of actions.
An ordering of the components (arrows)
Arrows play a crucial role in flowcharts as they establish the process's flow and the components' logical order. Arrows connect the different symbols, such as beginning and end points, activity steps, and decision points, to show the progression from one component to another. The direction of the arrows indicates the sequential order in which the components should be executed. Indicators are essential for maintaining the continuity and coherence of the process flow within the flowchart.
By incorporating these elements in your flowchart, you can visualize the sequence of events and decision points within a process, facilitating better understanding and communication among team members.
Step to turn it on in Excel
1. Head over to the “Insert” tab and then click the “SmartArt” button
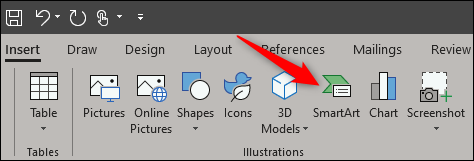
2. In the Choose a SmartArt Graphic window
Select the "Process" category on the left
Choose a type of process, and then click "OK."

3. Enter the relevant information

There are more ways you can choose from
1. How to Make a Flowchart: Beginner’s Guide in Visme (& Free Templates)
Know the purpose of your flowchart; if you're looking for professionally designed flowchart templates, browse through Visme's flowchart template library with dozens of options for various fields.
Shapes and symbols, you can now connect them with lines and arrows.

Connect your shapes with lines and arrows.

Split paths or add decisions. When you click on a shape to extend it, you can choose one of the pre-made split path blocks to develop your flowchart in two directions.

2. Create a basic flowchart in Visio
Creating a basic flowchart in Visio is a straightforward process that can help you visualize your process or workflow. Here are the steps to follow:
Start Visio:
Launch Microsoft Visio on your computer. You can typically find it in the list of installed applications. Alternatively, you can search for it in the "Start" menu.
Click the Flowchart category:
In Visio, you will find different categories of templates. Find and click on the "Flowchart" category to see the options specifically designed for creating flowcharts.
Double-click Basic Flowchart:
Locate the "Basic Flowchart" template within the Flowchart category and double-click on it. This selection will open a new drawing canvas with basic flowchart shapes and stencils.
Drag flowchart shapes onto your drawing:
Please select the appropriate flowchart shape from the stencil and drag it onto the drawing canvas for each step in the process you want to document. The flowchart shapes can represent start/end points, decisions, actions, or any other elements relevant to your procedure. Repeat this step for all the necessary steps in your approach.
Connect the flowchart shapes:
To establish the flow and connections between the shapes, connect them using connectors. Begin by hovering the mouse pointer over the first shape, and then click the small arrow that appears and points to the body you want to connect it to. If the second shape is not directly across from the first one, click and hold the small arrow, drag it to the second shape, and release the mouse button to drop the connector in the middle of the second shape. Repeat this step for all the required connections in your flowchart.
Add text to shapes or connectors:
You can add text to the shapes or connectors to provide additional information or labels for your flowchart. Select the form or connector to which you want to add text, and start typing. Once you finish typing, click on a blank area of the page to finalize the text entry. You can repeat this step for your flowchart's relevant shapes and connectors.
Change the direction of a connector's arrow:
If you need to modify the direction or style of an arrow on a connector:
Select the connector and go to the "Shape" tab at the top of the Visio interface.
In the "Shape Styles" group, click on "Line" and then point to "Arrows."
Choose the desired arrow direction and style from the available options.
By following these steps, you can create a basic flowchart using Visio. Remember to save your work regularly to avoid any potential loss of progress. Visio offers additional customization options and features to enhance the functionality and appearance of your flowchart. That allows you to create a visually appealing and professional representation of your process.

Best Alternative - WPS
WPS Office is a popular office productivity suite. It provides an excellent alternative for creating flowcharts within its applications, including Word, Excel, and PowerPoint. WPS Office Writer enables remote and efficient writing software for students, faculties, business runners, professional writers, and all kinds of users worldwide. The writer ensures users can access their work anywhere and in all forms, such as PDF and Word. The specific methods are shown in the link below:
Creating a Flowchart in WPS Word:

1. Launch WPS Word and open a new or existing document.
2. Go to the "Insert" tab and click the "Shapes" button in the Illustrations group.
3. Select the desired flowchart shape in the drop-down menu, such as a rectangle for activities or a diamond for decision points.
4. Click and drag on the document canvas to create the shape. Repeat this step for all the necessary conditions in your flowchart.
5. To connect the shapes, click on the "Line" shape from the "Shapes" menu and draw lines between the forms to represent the flow.
6. Customize the shapes and lines by changing their colours, sizes, and styles using the formatting options available in the WPS Word toolbar.
7. Add text to each shape by selecting it and typing the desired text. Format the text using font styles, sizes, and alignments.
8. Continue adding shapes, connecting them, and adding text until your flowchart is complete.
9. Save your document to retain the flowchart for future reference or share it with others.
Creating a Flowchart in WPS Excel:

Open WPS Excel and create a new or open existing workbook.
Determine the structure of your flowchart and consider using cells to represent each step or activity.
Enter the text or labels for each step in the corresponding cells.
Use cell borders, colours, and formatting options to create the shapes and connectors for your flowchart.
Draw lines between the cells to represent the flow of the process, using the "Insert" tab and the "Shapes" button to insert lines or arrows if needed.
Add additional formatting, such as changing the font style or cell background colour, to enhance the visual appeal of your flowchart.
Save your workbook to preserve the flowchart and share it as needed.
Creating a Flowchart in WPS PowerPoint:
1. Creative Blue People Chart:
This template allows you to represent a flowchart using creative blue-coloured people-shaped icons, making it engaging and visually appealing.
2. Cute Yellow Chart:
With its adorable yellow-themed design, this template adds a touch of playfulness to your flowchart while maintaining a professional look.
3. Creative Blue Piping Chart:
This template's creative blue piping design uniquely represents your flowchart, making it stand out and capture attention.
4. Creative Blue Sit Chart:
This template features a creative seating arrangement design in blue, allowing you to create a distinctive look and feel flowchart.
5. Business Blue Book Chart:
This template provides a professional and organized design with a book-inspired layout, ideal for creating flowcharts related to business processes.
6. Business Blue Transportation Chart:
With its transportation-themed design, this template offers a visually appealing option to illustrate flowcharts related to the supply chain, logistics, or transportation processes.
7. Funnel Flow Diagram:
This template caters explicitly to flowcharts involving sales or marketing processes and features a funnel-shaped design representing the flow of leads or customers.
8. Monthly Income Dynamic Data Chart:
Ideal for financial or budget-related flowcharts, this template allows you to present your data dynamically, enabling a visual representation of monthly income flow.
9. Tape Chart Comparison Chart:
This template offers a unique tape design to create flowcharts comparing different elements or options, allowing for clear visual differentiation.
10. Simple Gear Infographic Chart:
With its minimalistic and infographic-style design, this template provides a modern and clean look for creating flowcharts with a focus on clarity and simplicity.
WPS Office provides a user-friendly interface and a range of features to create and customize flowcharts within Word, Excel, and PowerPoint. Its versatility and compatibility make it an excellent alternative for those looking to develop flowcharts seamlessly within their preferred office suite.


FAQs
What is the difference between a flowchart and a process map?
A flowchart visualizes a workflow or process using standardized symbols to illustrate the sequence of decision points, steps, and the flow of information or materials. Flowcharts are generally more detailed and specific and provide a step-by-step view.
A process map provides a broader overview and emphasizes the interactions between different functions, departments, or stakeholders. Process maps often use swim lane diagrams to represent different roles or departments involved and showcase workflow across organizational boundaries.
Can flow charts be used for personal projects?
Yes, flowcharts can be used for personal projects as well. Flowcharts are not limited to professional or organizational use only. They can be effective for decision-making processes, planning complex tasks, personal project management, or organizing individual workflows. Flowcharts can help you identify dependencies, visualize the steps involved, track progress, and ensure that your projects are well-structured and executed efficiently.
How do I know if my flowchart is accurate and complete?
To ensure the accuracy and completeness of your flowchart, consider the following:
Review it with stakeholders
Validate it against existing documentation
Follow the process steps
Test it for completeness
What is the most common mistake to avoid when creating a flow chart?
The most common mistake to avoid when creating a flowchart is overloading or overcomplicating it with unnecessary details. Here are some tips to prevent this mistake:
Keep it concise
Use consistent symbols and notation
Clearly label shapes and connectors
Test it for readability
Summary
In summary, this article discusses the process of creating flowcharts and highlights the benefits of using WPS Office as the best alternative. It provides step-by-step instructions for creating flowcharts in Microsoft Visio and emphasizes the importance of visualizing complex processes for teams.
Additionally, it introduces ten professional WPS PowerPoint templates, including options that offer visually appealing designs for creating flowcharts in various industries. With WPS Office, users can easily create engaging flowcharts to communicate workflows and processes effectively.

'%3e%3cpath%20d='M19.9911%204.11386V6.471H18.5894C18.0775%206.471%2017.7322%206.57814%2017.5536%206.79243C17.3751%207.00671%2017.2858%207.32814%2017.2858%207.75671V9.44421H19.9019L19.5536%2012.0871H17.2858V18.8639H14.5536V12.0871H12.2769V9.44421H14.5536V7.49779C14.5536%206.39064%2014.8632%205.53201%2015.4822%204.92189C16.1013%204.31177%2016.9257%204.00671%2017.9554%204.00671C18.8304%204.00671%2019.509%204.04243%2019.9911%204.11386Z'%20fill='%23333333'/%3e%3c/g%3e%3cdefs%3e%3cclipPath%20id='clip0_2938_8199'%3e%3crect%20width='16'%20height='16'%20fill='white'%20transform='translate(8%204.00671)'/%3e%3c/clipPath%3e%3c/defs%3e%3c/svg%3e)
'%3e%3cpath%20d='M17.5237%2010.7813L23.4811%204H22.0699L16.8949%209.88693L12.7648%204H8L14.2469%2012.9029L8%2020.0133H9.4112L14.8725%2013.7952L19.2352%2020.0133H24M9.92053%205.04213H12.0885L22.0688%2019.0224H19.9003'%20fill='%23333333'/%3e%3c/g%3e%3cdefs%3e%3cclipPath%20id='clip0_2938_8200'%3e%3crect%20width='16'%20height='16.0134'%20fill='white'%20transform='translate(8%204)'/%3e%3c/clipPath%3e%3c/defs%3e%3c/svg%3e)


