

'%3e%3cpath%20d='M8%200C12.4183%200%2016%203.58172%2016%208C16%2012.4183%2012.4183%2016%208%2016C3.58172%2016%200%2012.4183%200%208C0%203.58172%203.58172%200%208%200ZM11.6162%204.38379C11.2257%203.99337%2010.5927%203.99338%2010.2021%204.38379L8%206.58594L5.79785%204.38379C5.40732%203.99334%204.77429%203.99329%204.38379%204.38379C3.99331%204.77429%203.99335%205.40733%204.38379%205.79785L6.58594%208L4.38379%2010.2021C3.99348%2010.5927%203.99341%2011.2257%204.38379%2011.6162C4.77426%2012.0066%205.40734%2012.0065%205.79785%2011.6162L8%209.41406L10.2021%2011.6162C10.5927%2012.0066%2011.2257%2012.0067%2011.6162%2011.6162C12.0067%2011.2257%2012.0066%2010.5927%2011.6162%2010.2021L9.41406%208L11.6162%205.79785C12.0066%205.40735%2012.0066%204.77429%2011.6162%204.38379Z'%20fill='%23080E17'%20fill-opacity='0.46'/%3e%3c/g%3e%3cdefs%3e%3cclipPath%20id='clip0_3761_713'%3e%3crect%20width='16'%20height='16'%20fill='white'/%3e%3c/clipPath%3e%3c/defs%3e%3c/svg%3e)



'%3e%3cpath%20fill-rule='evenodd'%20clip-rule='evenodd'%20d='M21.4999%2010.9993C21.4999%205.20009%2016.7986%200.498901%2010.9993%200.498901C5.19994%200.498901%200.498657%205.20009%200.498657%2010.9993C0.498657%2016.2404%204.33858%2020.5844%209.35855%2021.3722V14.0346H6.69238V10.9993H9.35855V8.68594C9.35855%206.05427%2010.9262%204.60062%2013.3248%204.60062C14.4736%204.60062%2015.6753%204.80571%2015.6753%204.80571V7.38979H14.3512C13.0468%207.38979%2012.64%208.19921%2012.64%209.0296V10.9993H15.5523L15.0867%2014.0346H12.64V21.3722C17.66%2020.5844%2021.4999%2016.2404%2021.4999%2010.9993Z'%20fill='%231568EA'/%3e%3c/g%3e%3c/svg%3e)


'%3e%3cpath%20d='M2.42045%2022.1876H6.31818V12.7217L0.75%208.54553V20.5171C0.75%2021.4414%201.49892%2022.1876%202.42045%2022.1876Z'%20fill='%234285F4'/%3e%3cpath%20d='M19.682%2022.1876H23.5797C24.5041%2022.1876%2025.2502%2021.4387%2025.2502%2020.5171V8.54553L19.682%2012.7217'%20fill='%2334A853'/%3e%3cpath%20d='M19.682%205.48293V12.7216L25.2502%208.54543V6.31816C25.2502%204.25236%2022.8921%203.07469%2021.2411%204.31361'%20fill='%23FBBC04'/%3e%3cpath%20d='M6.31824%2012.7217V5.48303L13.0001%2010.4944L19.6819%205.48303V12.7217L13.0001%2017.733'%20fill='%23EA4335'/%3e%3cpath%20d='M0.75%206.31816V8.54543L6.31818%2012.7216V5.48293L4.75909%204.31361C3.10534%203.07469%200.75%204.25236%200.75%206.31816Z'%20fill='%23C5221F'/%3e%3c/g%3e%3cdefs%3e%3cclipPath%20id='clip0_2954_7305'%3e%3crect%20width='24.5'%20height='18.375'%20fill='white'%20transform='translate(0.75%203.8125)'/%3e%3c/clipPath%3e%3c/defs%3e%3c/svg%3e)


You do not need a paid portfolio app to follow your positions — a five-column sheet answers "what is it worth today" in seconds. This tracker is built around one rule: keep the stock price in its own column so every profit, loss, and allocation figure updates the moment you refresh it.

Stock Price Tracker: Build a Free Portfolio in Excel
Build the Stock Price Table in WPS Spreadsheet
Set the sheet up once and the same layout works for ten holdings or a hundred.
In row 1 type the headers: Ticker, Shares, Buy Price, Stock Price, Value, Gain/Loss, Return %.
Enter your holdings under Ticker, Shares, and Buy Price. Leave the Stock Price column empty for now.
In the Value column use =B2*D2 (shares multiplied by the current stock price).
In Gain/Loss use =(D2-C2)*B2, and in Return % use =IFERROR((D2-C2)/C2,"") so a blank price never shows an error.
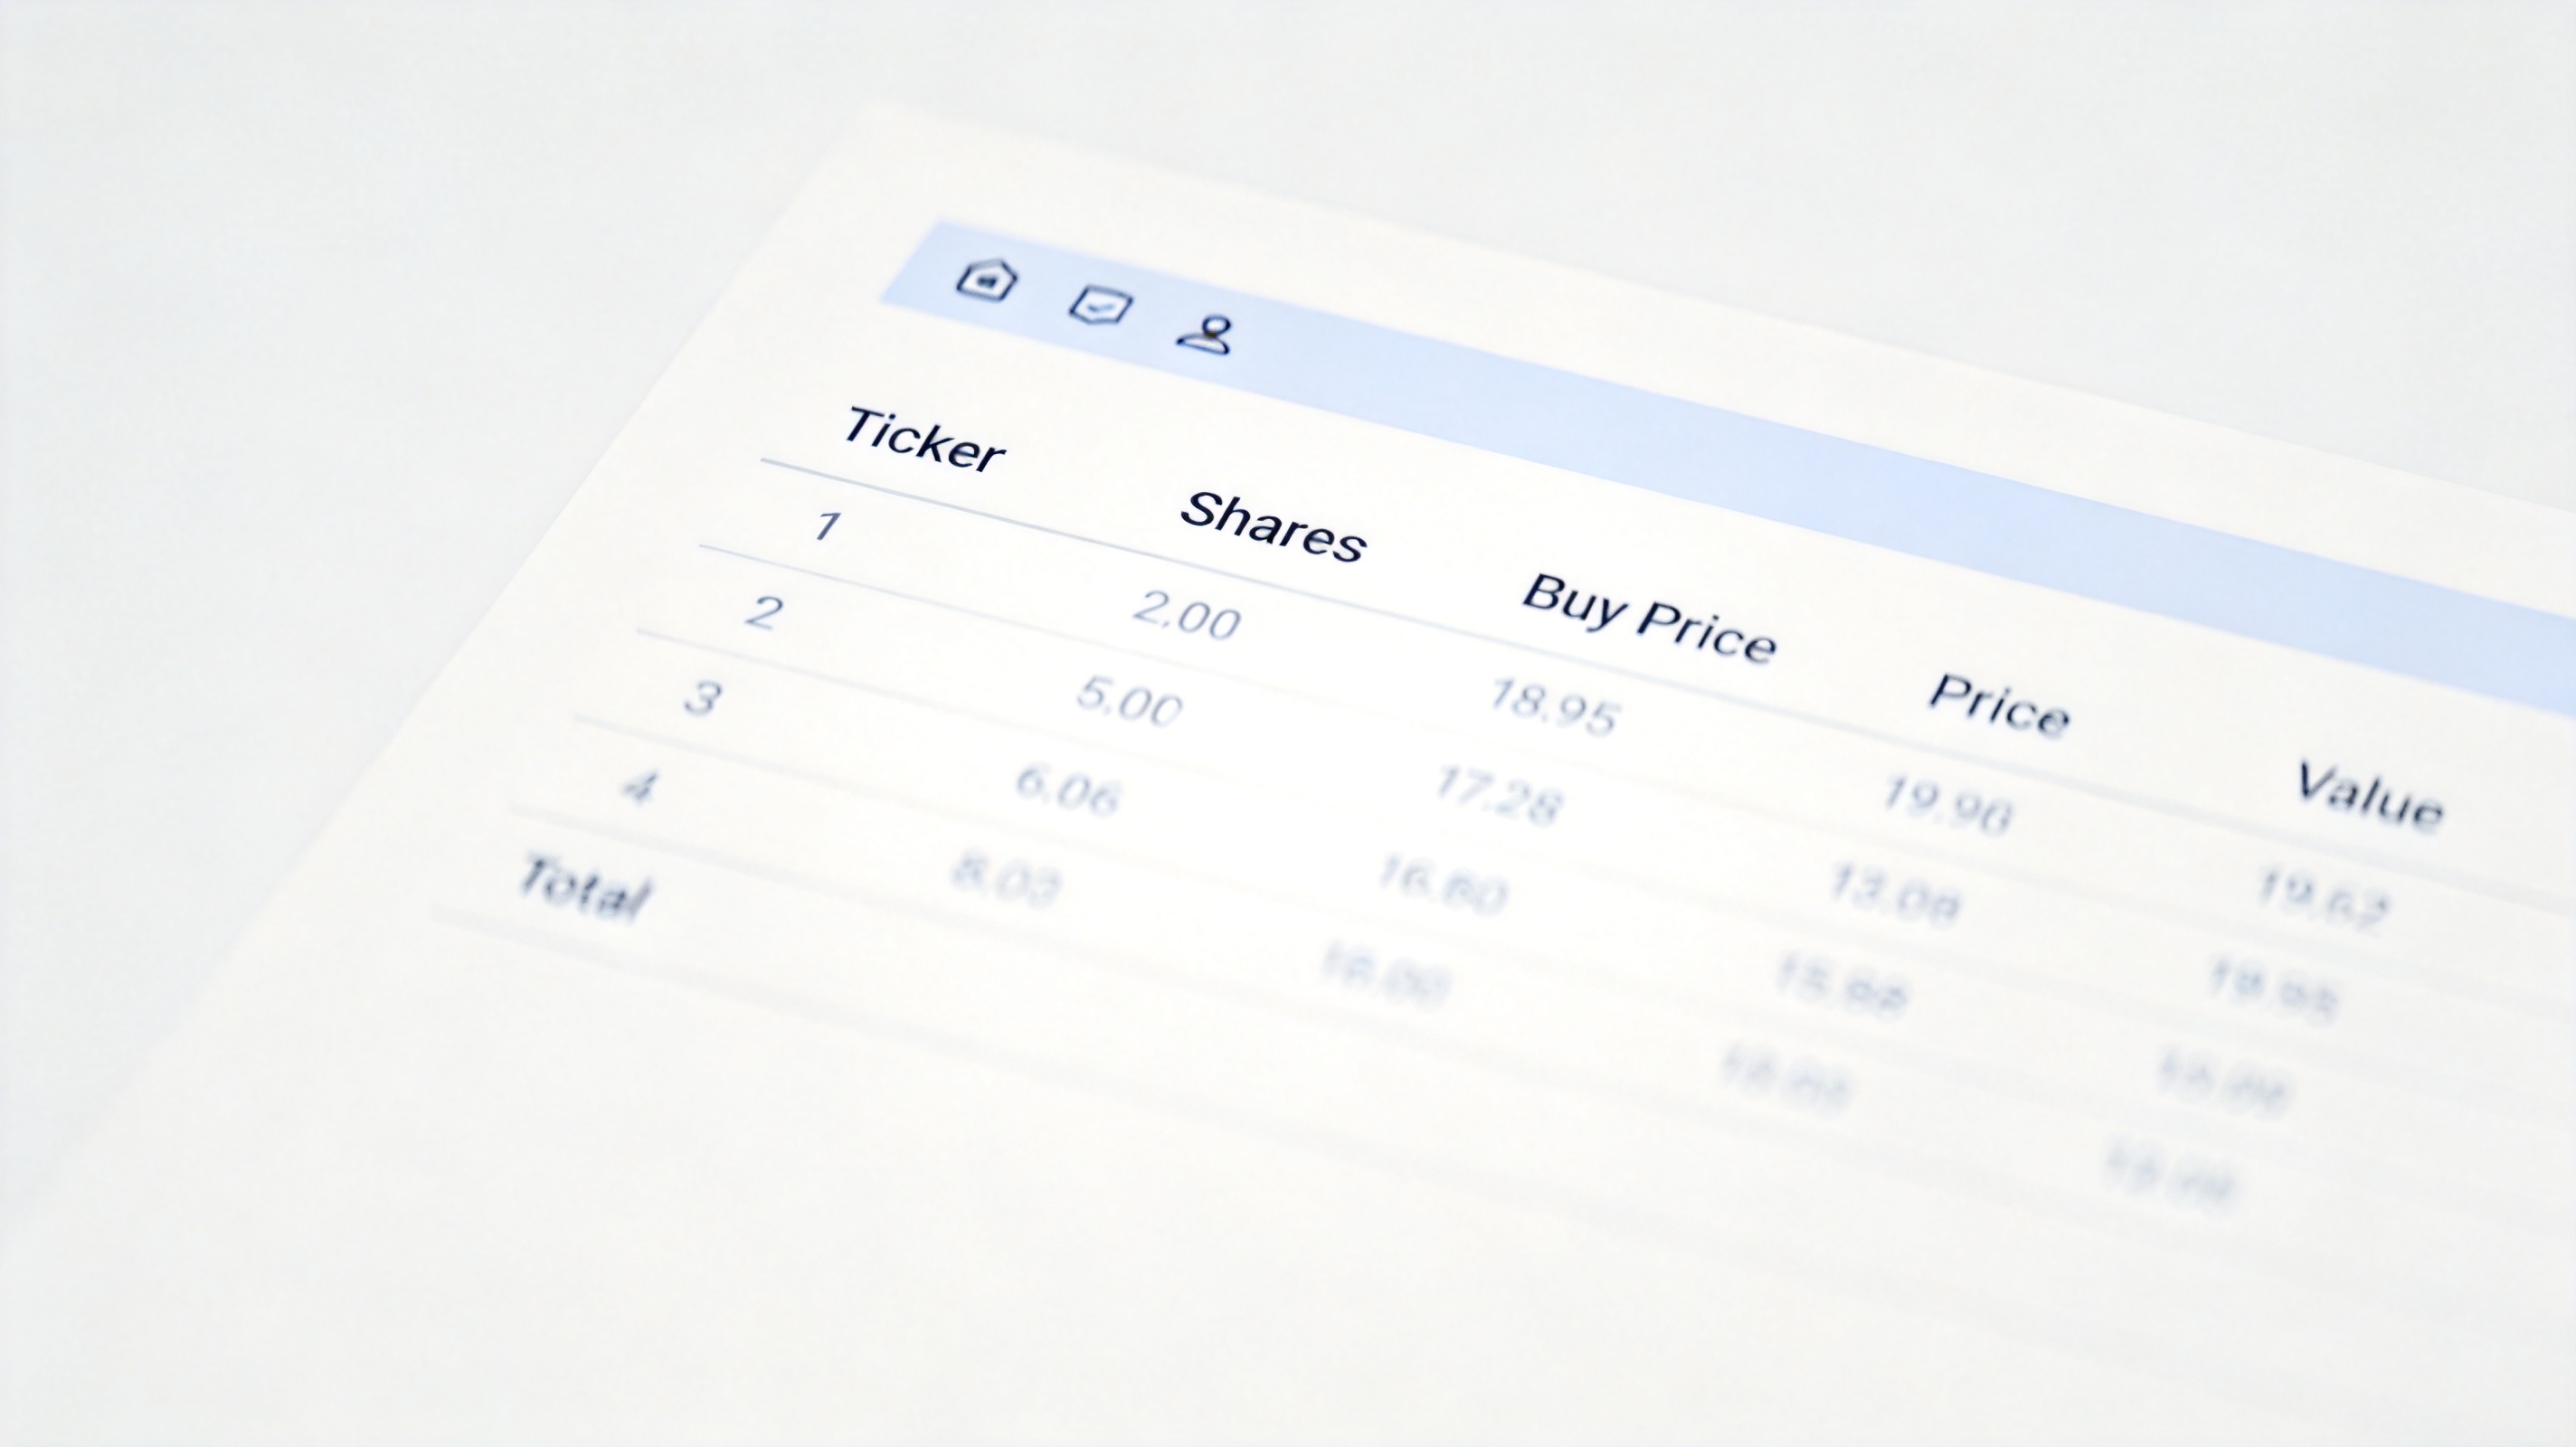
Stock price table layout in WPS Spreadsheet


Update Stock Prices Without Typing Every Number
A hand-typed price goes stale the moment the market moves. Two habits keep the sheet current without a subscription data feed.
Download a CSV of your positions or a quote list from your broker, then open it in WPS Spreadsheet with Data > Import Data and copy the closing prices into the Stock Price column.
Keep a dated column per week if you want history — Price 2026-10-16, Price 2026-10-23 — so you can chart the trend later.
Note that the Microsoft 365 Stocks data type is not available in WPS Spreadsheet, so treat any online price you paste as a snapshot rather than a live tick.
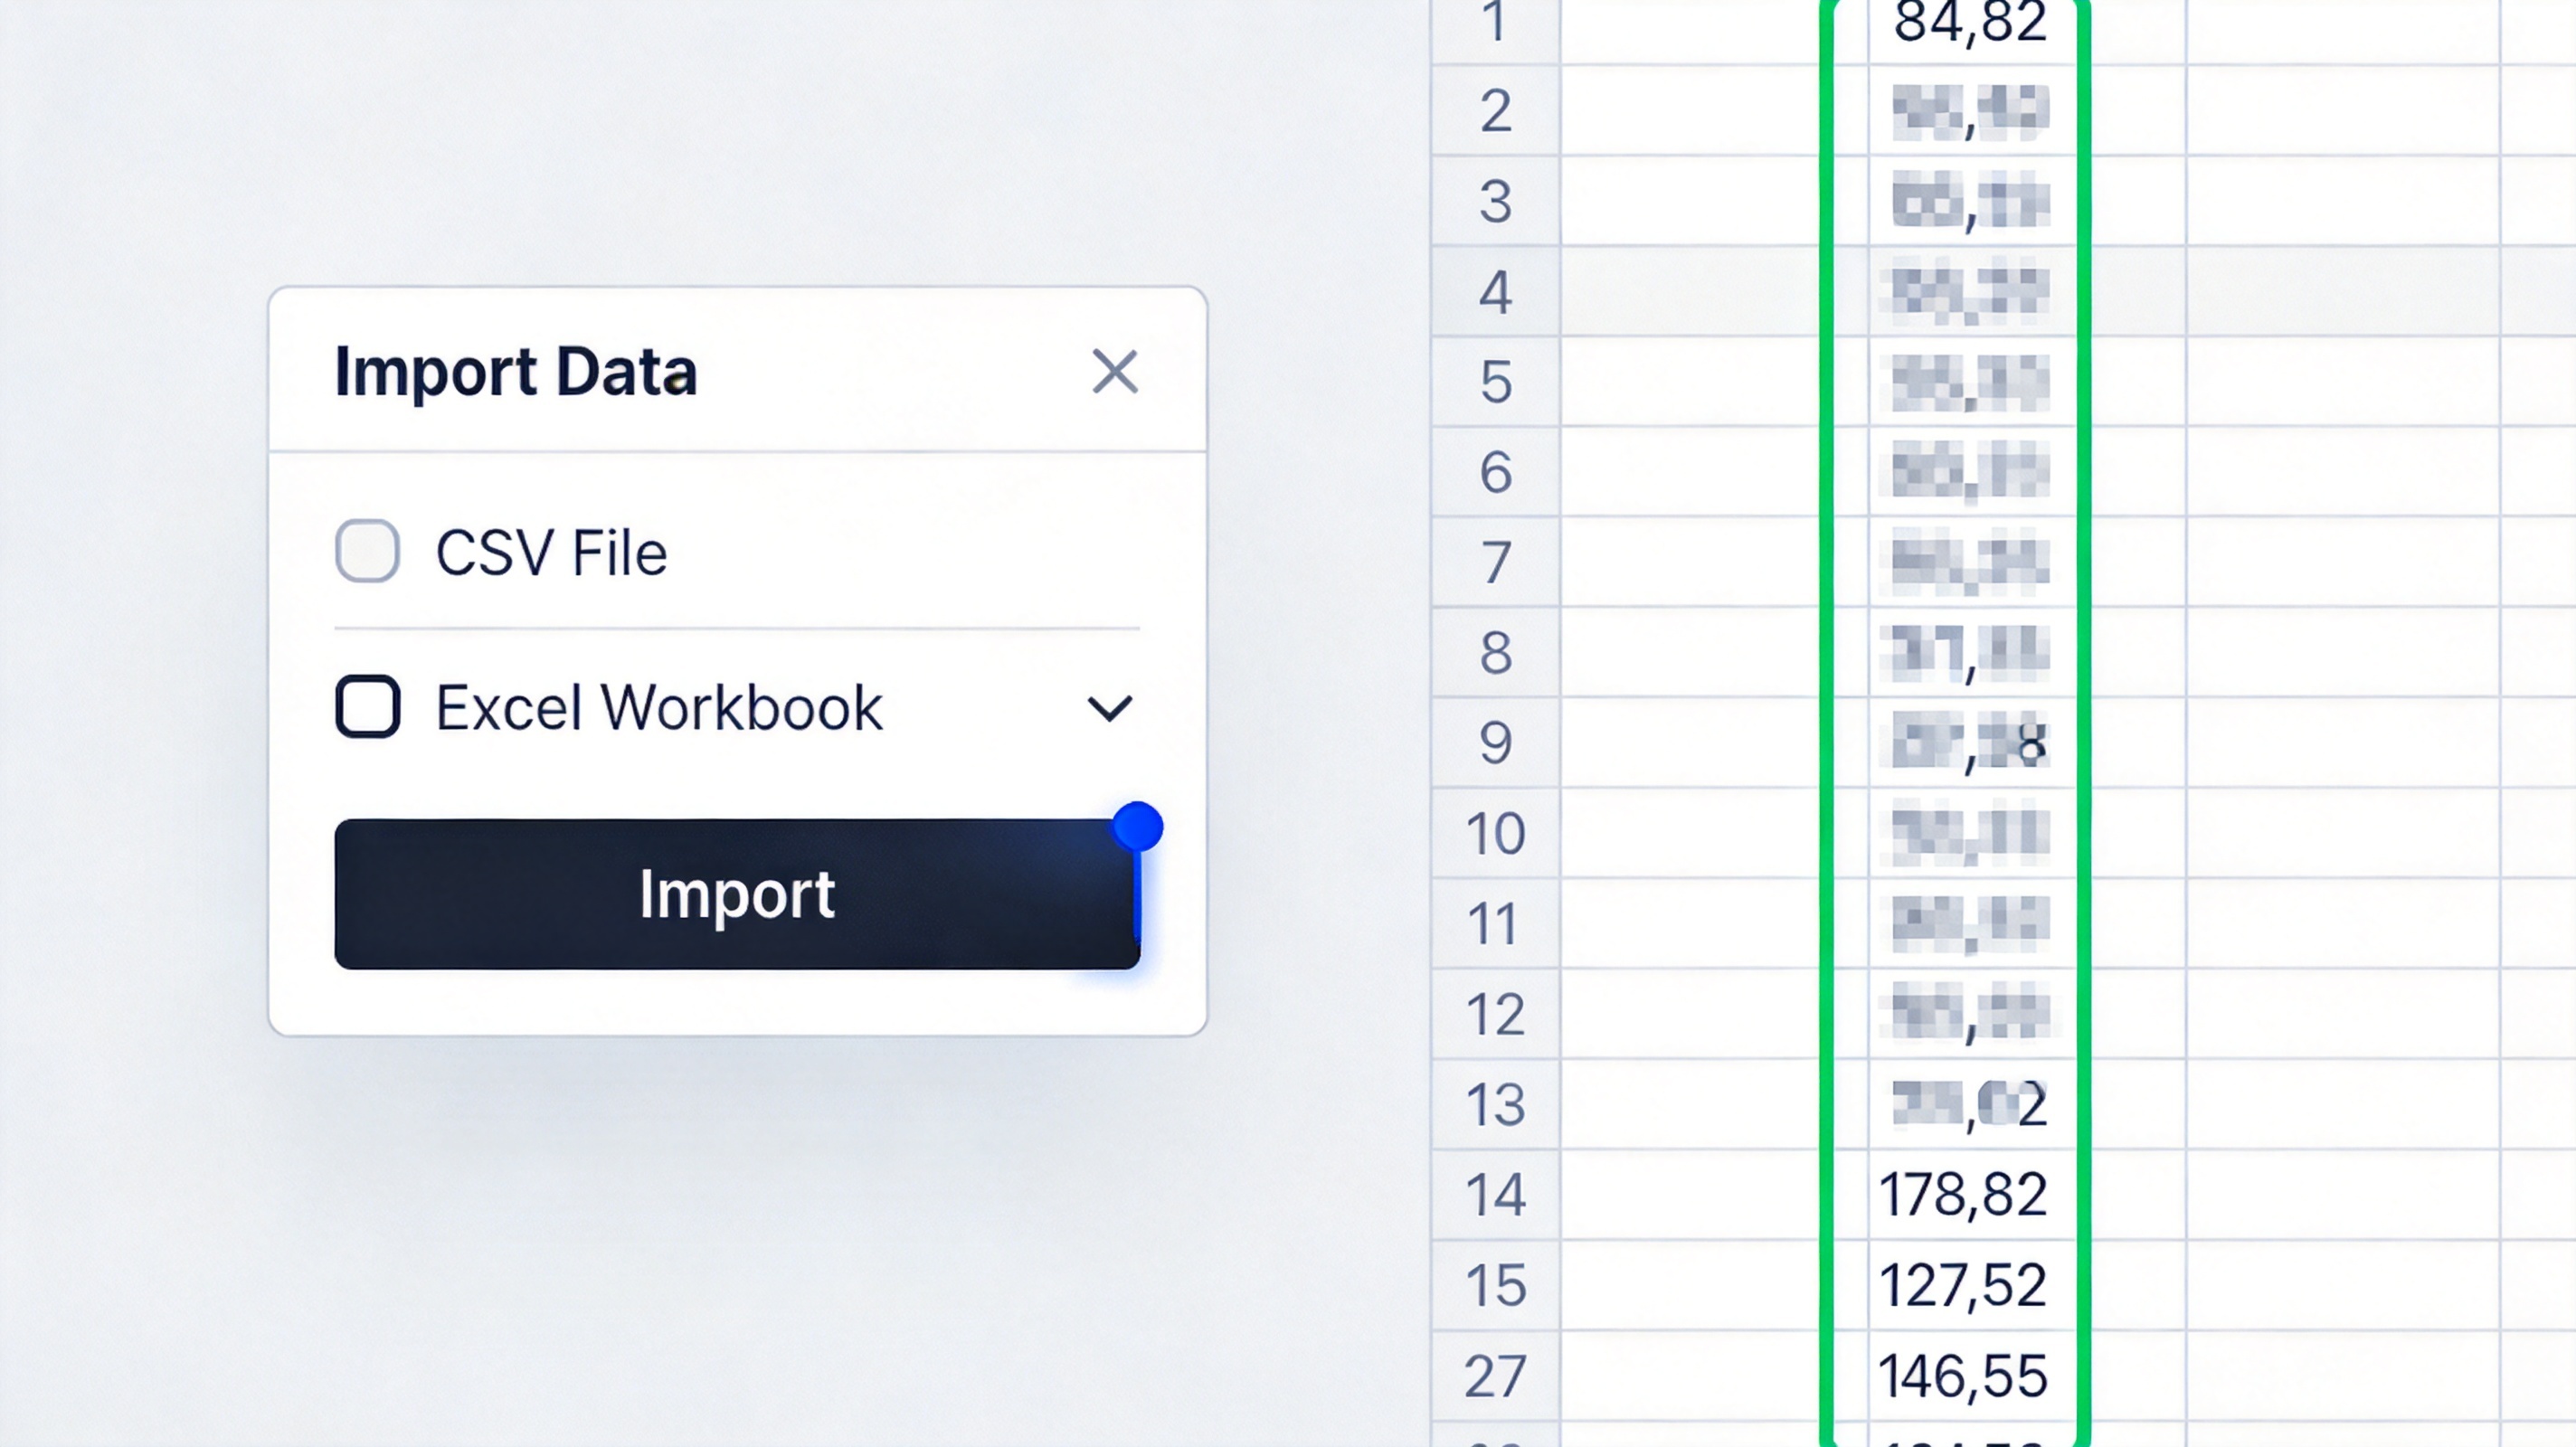
Import stock prices from a CSV file
Turn Prices into Profit, Loss, and Allocation
Now the summary rows do the reading for you.
Below the last row, total the portfolio with =SUM(E2:E20) for value and =SUM(F2:F20) for gain or loss.
Add an Allocation % column with =IFERROR(E2/$E$21,""), pointing at the total cell.
Select the Return % column and apply Conditional Formatting > Highlight Cells Rules so any holding below your chosen threshold turns red.
Insert a donut chart from the Ticker and Allocation columns to see concentration at a glance.
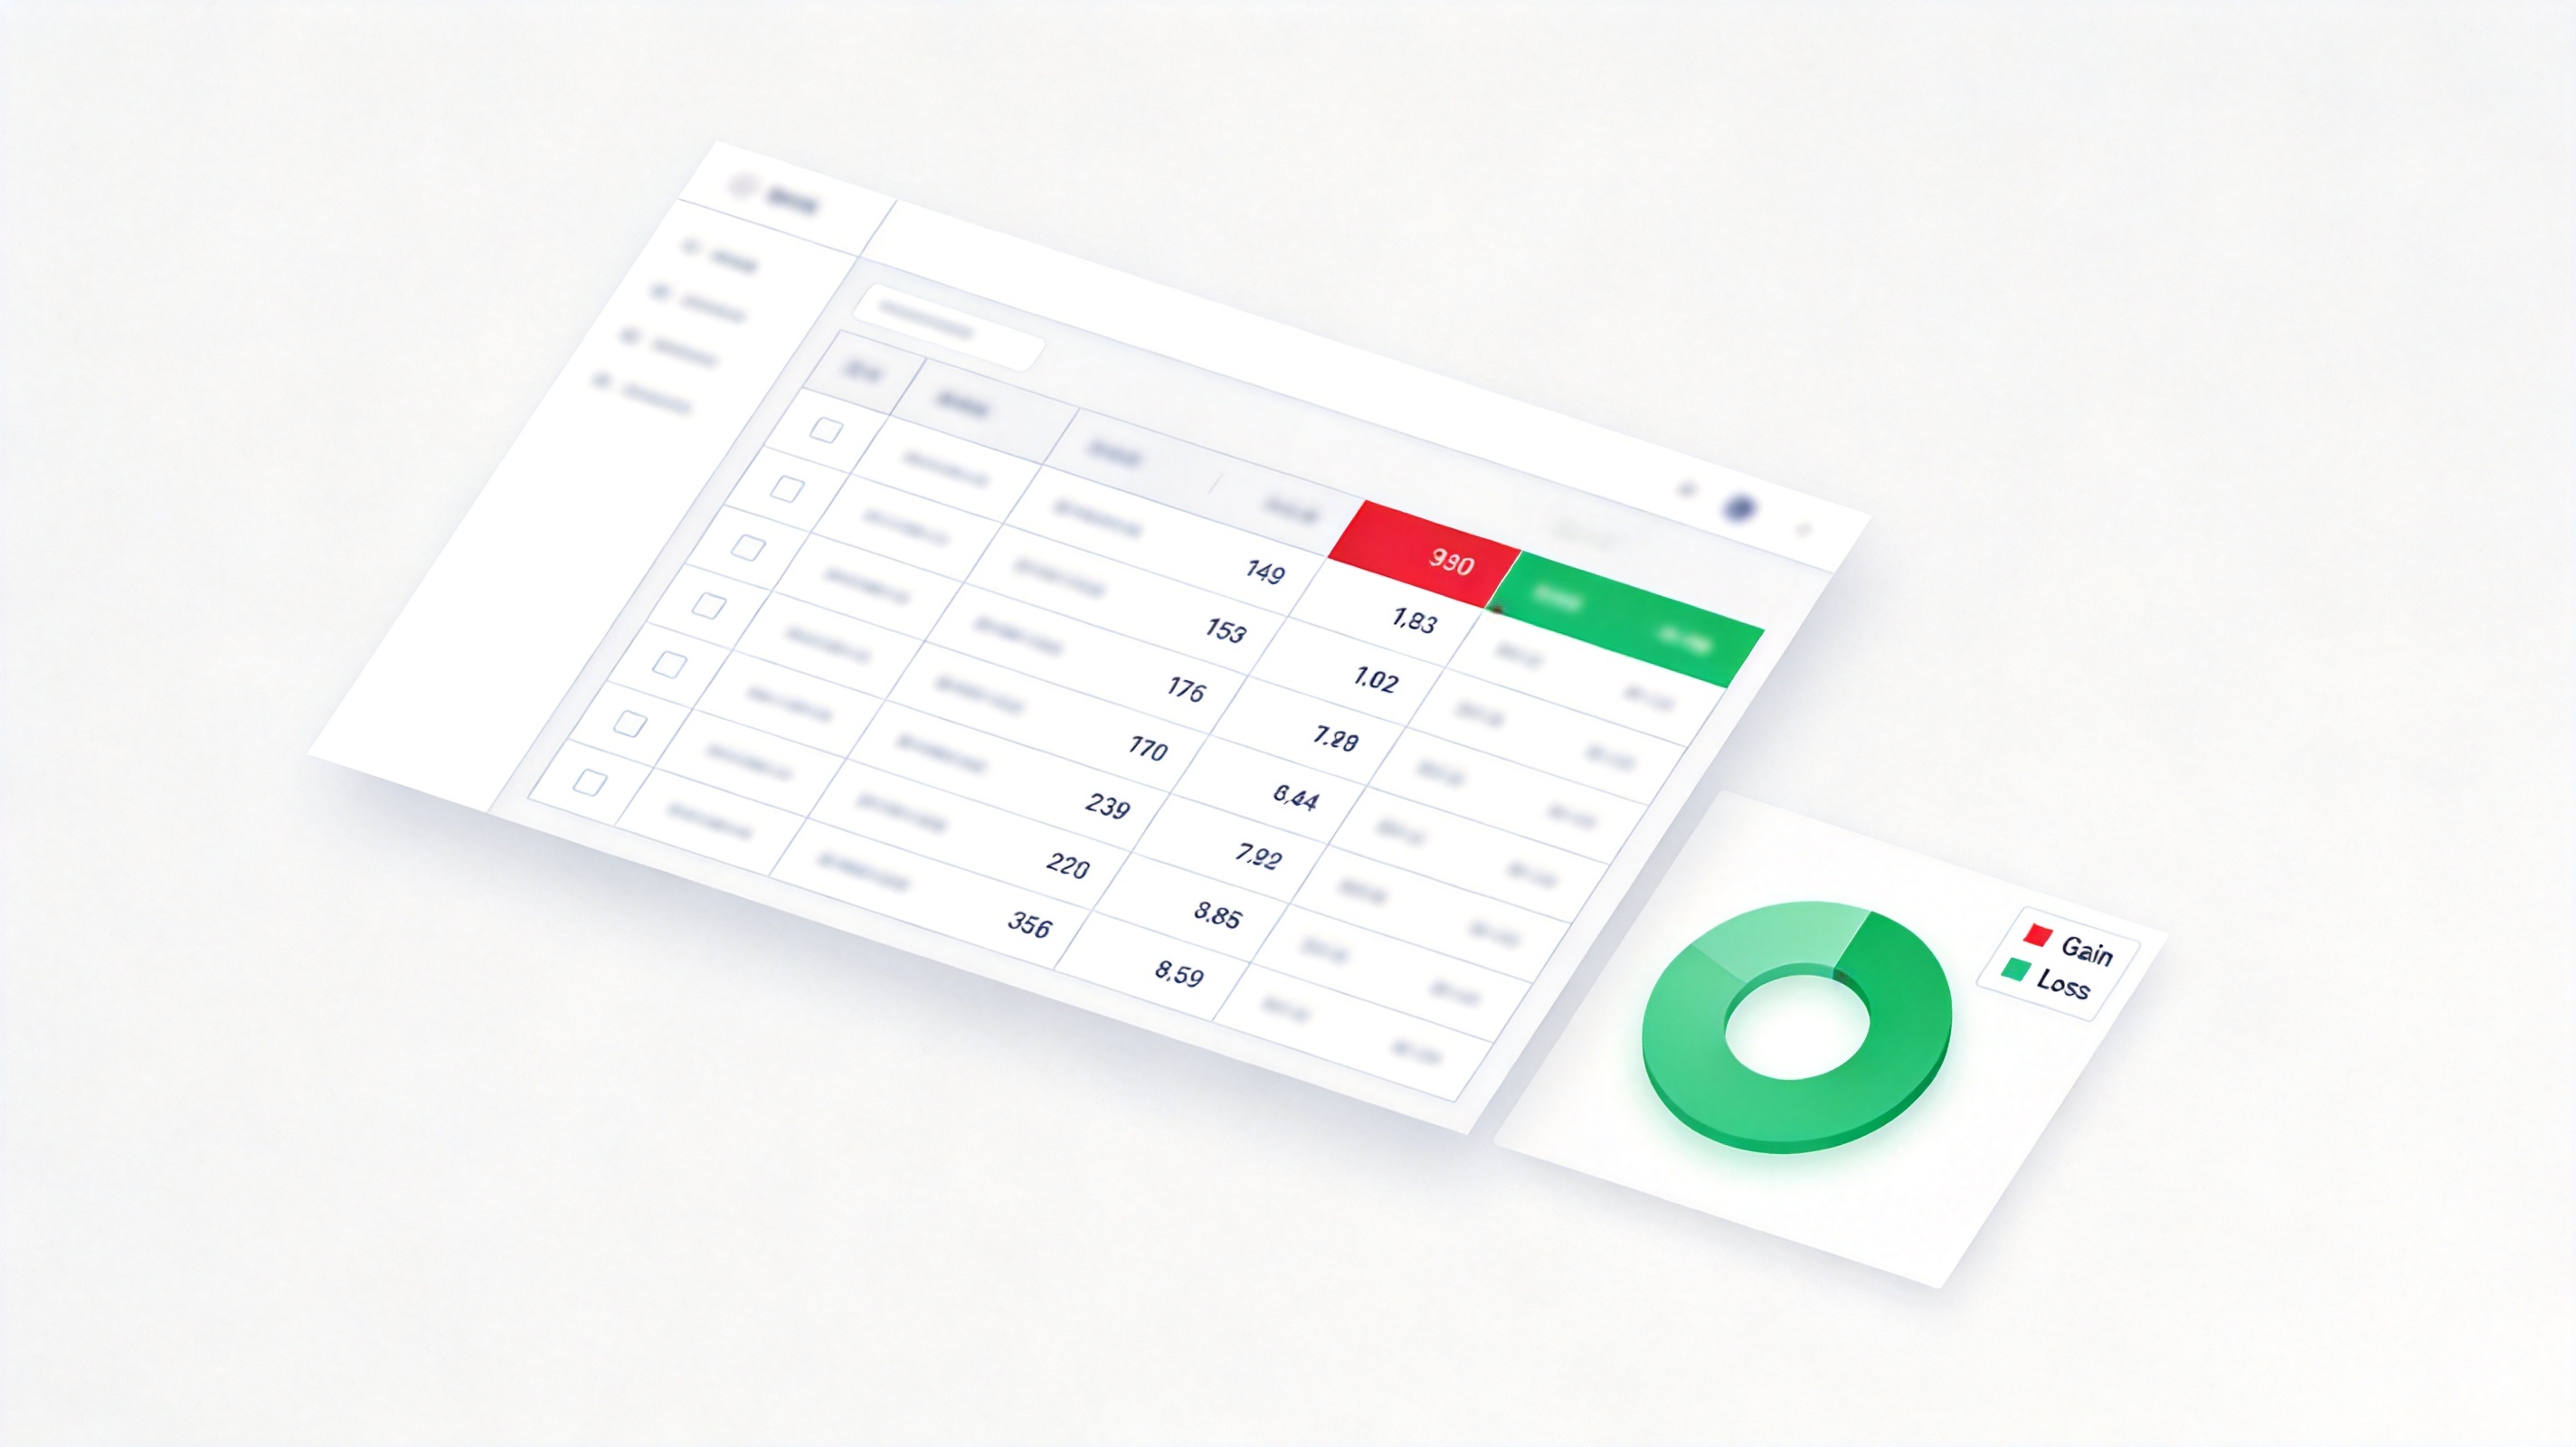
Profit, loss, and allocation in a portfolio sheet
The Best Free Alternative: WPS Office
The Microsoft 365 Stocks data type is locked to a subscription, yet the maths behind a tracker — multiply, subtract, divide — is the same in every spreadsheet. WPS Spreadsheet opens your existing .xlsx portfolio for free and keeps every formula and chart intact.
| What you need | WPS Spreadsheet | Microsoft Excel |
|---|---|---|
| Portfolio formulas and charts | Included | Included |
| Opening .xlsx files | Full compatibility | Full compatibility |
| Built-in Stocks data type | Not included — import a CSV | Microsoft 365 only |
| Cost | Free for everyday use | Subscription |
No licence wall: conditional formatting and donut charts are free, so the tracker looks the same at zero cost.
Same file, same formulas: your SUM, IFERROR, and IF formulas keep working when Excel opens the workbook.
Works offline: prices you import stay on your device instead of syncing to a cloud service.
Free templates: start from a ready-made budget or tracker layout instead of a blank grid.
WPS Spreadsheet for a stock price tracker
FAQs
Does Excel track stock prices automatically?
Only Microsoft 365 offers the Stocks data type, which can refresh quotes for a ticker. In other versions, and in WPS Spreadsheet, you import or paste a price list instead.
Can I build this tracker for free?
Yes. The tracker is a plain spreadsheet, so any free tool that opens .xlsx — including WPS Spreadsheet — can run it with no subscription.
How often should I update the stock price column?
As often as you check the portfolio. Daily refresh is enough for most people; weekly is fine if you only review positions at the weekend.
How do I calculate total return on a portfolio?
Total the Gain/Loss column with SUM and divide it by the total cost, which is SUM(Shares multiplied by Buy Price). Format the result as a percentage.
Can I track dividend payments in the same sheet?
Add a Dividend column and include it in the Value total, or keep a separate Income sheet and pull the running total into the summary row.


'%3e%3cpath%20d='M19.9911%204.11386V6.471H18.5894C18.0775%206.471%2017.7322%206.57814%2017.5536%206.79243C17.3751%207.00671%2017.2858%207.32814%2017.2858%207.75671V9.44421H19.9019L19.5536%2012.0871H17.2858V18.8639H14.5536V12.0871H12.2769V9.44421H14.5536V7.49779C14.5536%206.39064%2014.8632%205.53201%2015.4822%204.92189C16.1013%204.31177%2016.9257%204.00671%2017.9554%204.00671C18.8304%204.00671%2019.509%204.04243%2019.9911%204.11386Z'%20fill='%23333333'/%3e%3c/g%3e%3cdefs%3e%3cclipPath%20id='clip0_2938_8199'%3e%3crect%20width='16'%20height='16'%20fill='white'%20transform='translate(8%204.00671)'/%3e%3c/clipPath%3e%3c/defs%3e%3c/svg%3e)
'%3e%3cpath%20d='M17.5237%2010.7813L23.4811%204H22.0699L16.8949%209.88693L12.7648%204H8L14.2469%2012.9029L8%2020.0133H9.4112L14.8725%2013.7952L19.2352%2020.0133H24M9.92053%205.04213H12.0885L22.0688%2019.0224H19.9003'%20fill='%23333333'/%3e%3c/g%3e%3cdefs%3e%3cclipPath%20id='clip0_2938_8200'%3e%3crect%20width='16'%20height='16.0134'%20fill='white'%20transform='translate(8%204)'/%3e%3c/clipPath%3e%3c/defs%3e%3c/svg%3e)


