

Four apps ship in Microsoft Office, and most of the confusion comes from asking them to do each other's jobs. Someone builds a budget in Word, someone else pastes a chart into Outlook, and the file arrives broken.
The short answer: Excel is the Microsoft Office product built for spreadsheets, tables and charts. Word, PowerPoint and Outlook can each display a table or a chart, but none of them can calculate, sort, refresh or recalculate the data behind it. Below is what each app actually does with a table, what it does with a chart, and where the hand-off should happen.
Excel, Word, PowerPoint or Outlook: Which Handles Tables and Charts?
Excel: the Microsoft Office app built for spreadsheets, tables and charts
Excel is the only app in the suite where a table is a data structure rather than a piece of layout. Press Ctrl+T (or use Insert → Table) and the range becomes a real table: it expands when you type in the row below, the headers stay visible while you scroll, and every formula can refer to the table by name instead of a cell range.
Charts work the same way. Insert → Charts gives you column, bar, line, pie, scatter, histogram, waterfall and combination charts, all bound to a range or a table. Change a number and the chart redraws; add a row and the series extends. That live link is the part the other three apps cannot reproduce.
The features people actually rely on sit on top of that base:
Formulas and functions that recalculate the whole sheet after one edit.
PivotTables that summarise thousands of rows without writing a formula.
Sorting and filtering that move whole records, not just text in a column.
Power Query for pulling in a CSV or a database and refreshing it later.
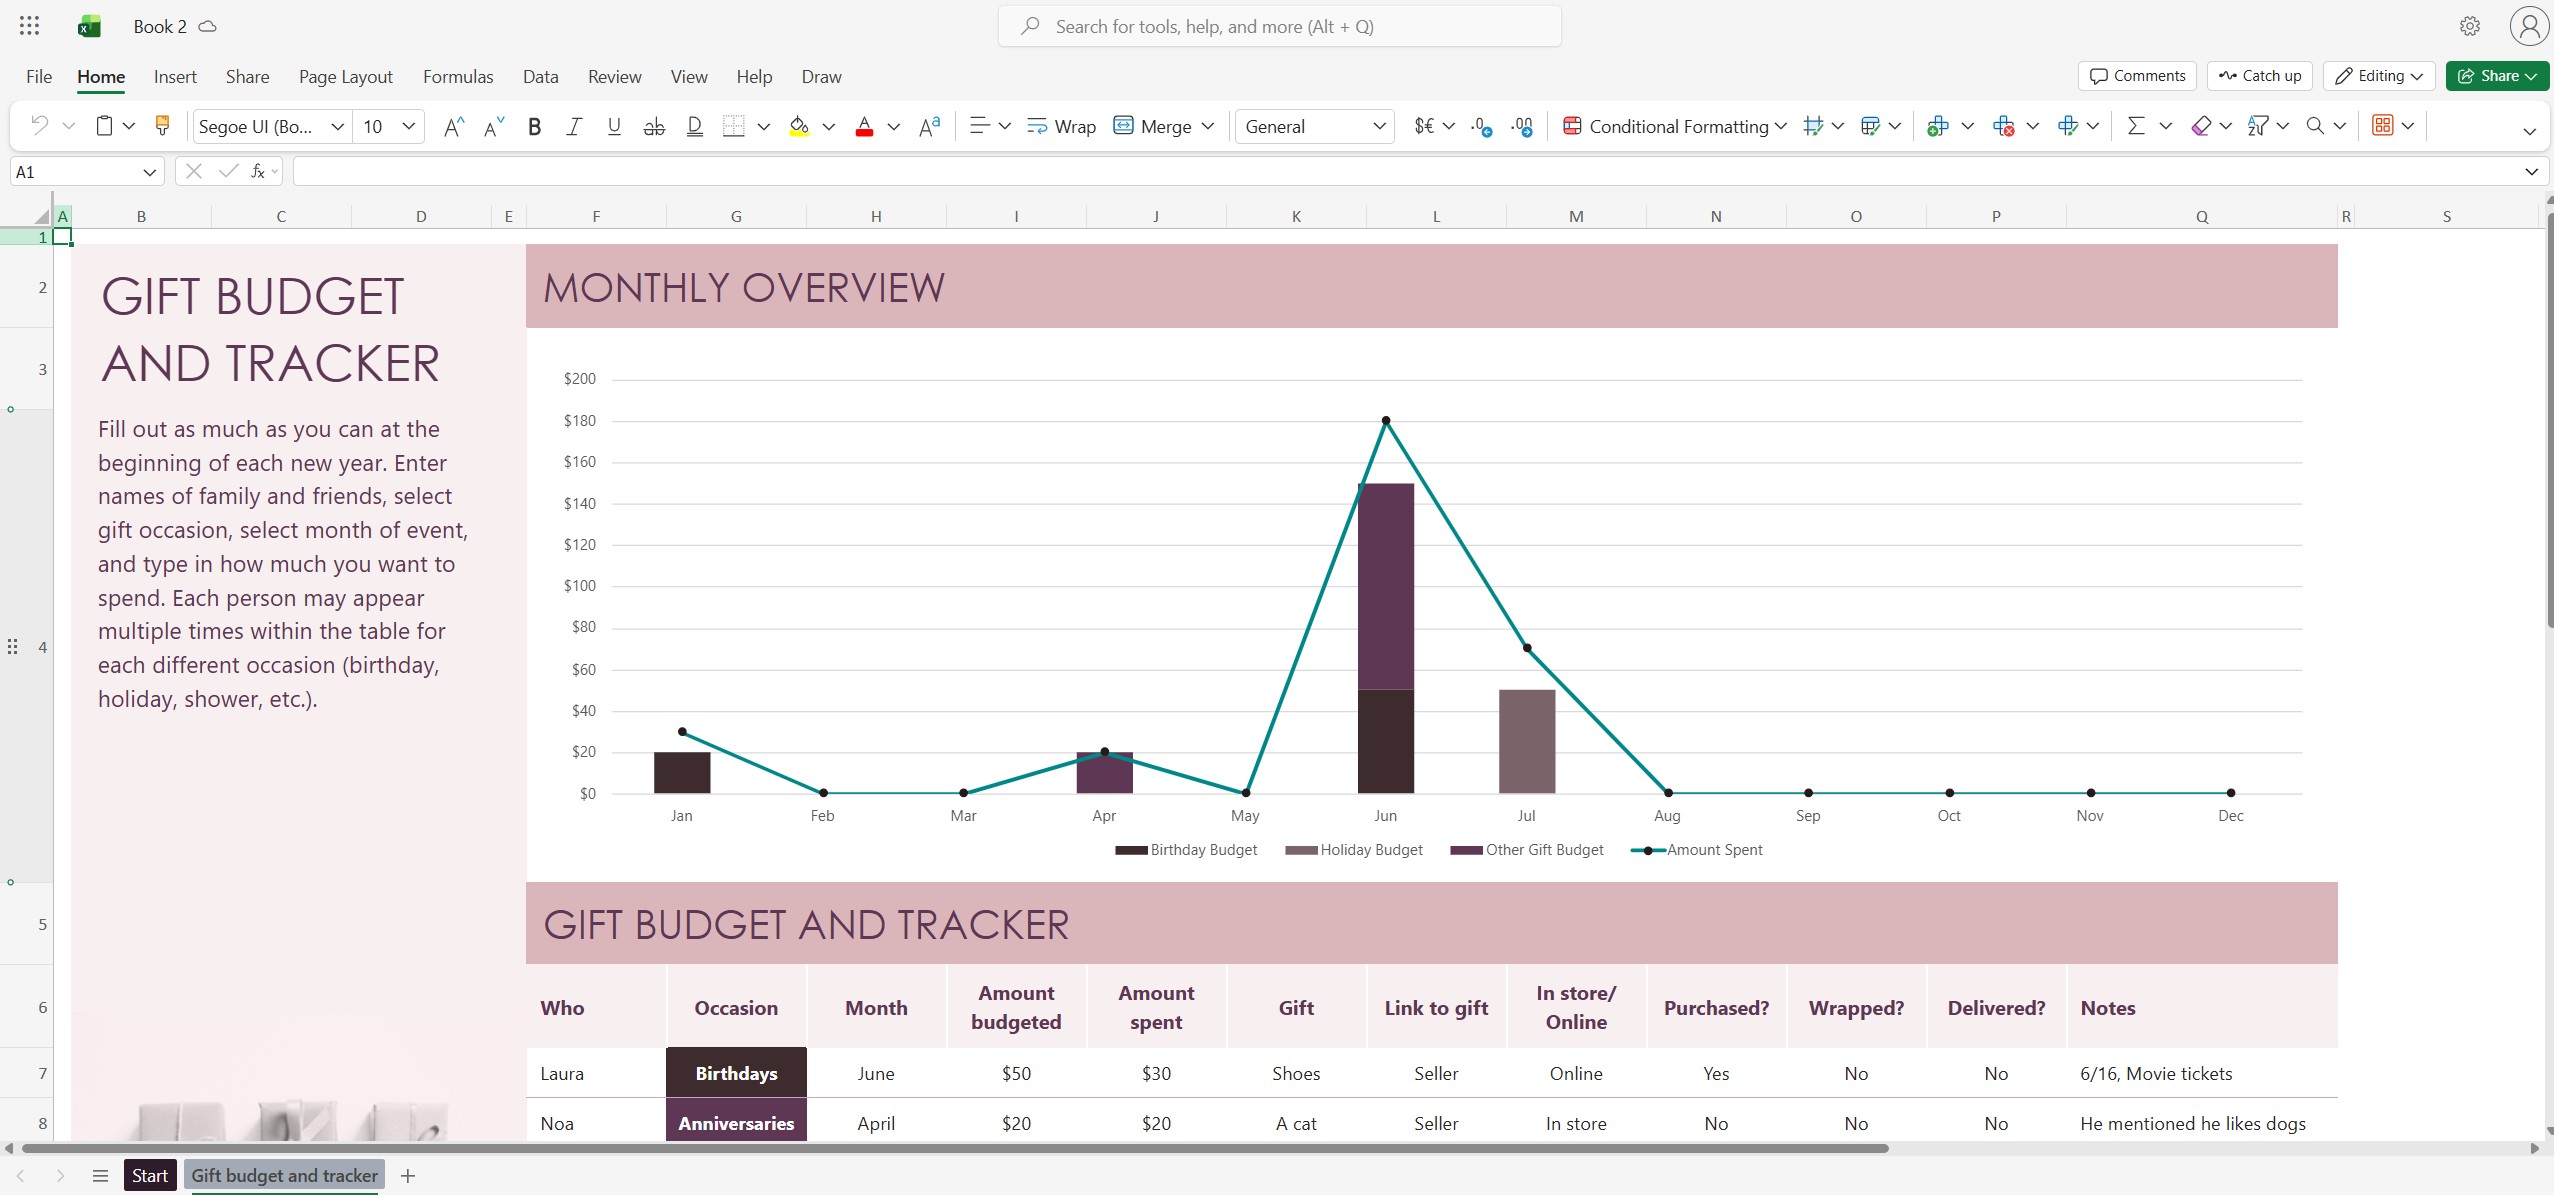
Excel table with chart and totals


How to set up a table that survives being moved between apps
Most complaints about “Excel breaking” trace back to a table that was built like a document. Six rules prevent almost all of it, and every one of them also decides whether a chart or a PivotTable can read the data later.
One data type per column. A phone column holding both text and numbers cannot be sorted or summed, and Excel will treat the whole column as text.
One header row, no merged cells. A merged header looks tidy on screen and destroys filters, sorts and PivotTables underneath.
No blank rows or columns inside the range. Excel stops reading at the first gap, so a spacer row silently cuts the dataset in half.
Numbers stored as numbers. Currency symbols, units and spaces belong in the header, not in the cell, or the total comes back as zero.
One date format across the column. Mixed formats sort as text, which is why “sorted by date” sometimes arrives in alphabetical order.
Use a table object, not a plain range. Ctrl+T makes the range expand with new rows and lets formulas refer to the table by name, so a moved column does not break the reference.
This is the difference between a table as layout and a table as data. Word is built for the first; Excel is the only app in Microsoft Office built for the second, which is why the same six rules make a spreadsheet portable and a document table fragile.
Word: good at laying out a table, not at keeping one
Word has a table tool, and for a document it is the right one. Insert → Table builds a grid you can merge, shade and size in centimetres — ideal for a resume, a specification sheet or a comparison on page two of a proposal.
What it does not do is behave like data. There is no sorting that keeps a record intact beyond the basic dialog, no filtering, no pivot summary, no recalculation of a dependent column. A formula such as =SUM(ABOVE) works inside a cell, but it recalculates on demand and quietly goes stale when rows are inserted above it.
Charts in Word are a borrowed Excel object. When you use Insert → Chart, Word opens a small spreadsheet grid behind the chart for the numbers. Edit those numbers and the chart updates, but that grid lives inside the document — it is not connected to any workbook on your disk. For a one-page report that is fine. For anything that gets revised monthly, it is double entry.
Use Word when the table is part of the argument, and Excel when the table is the argument.
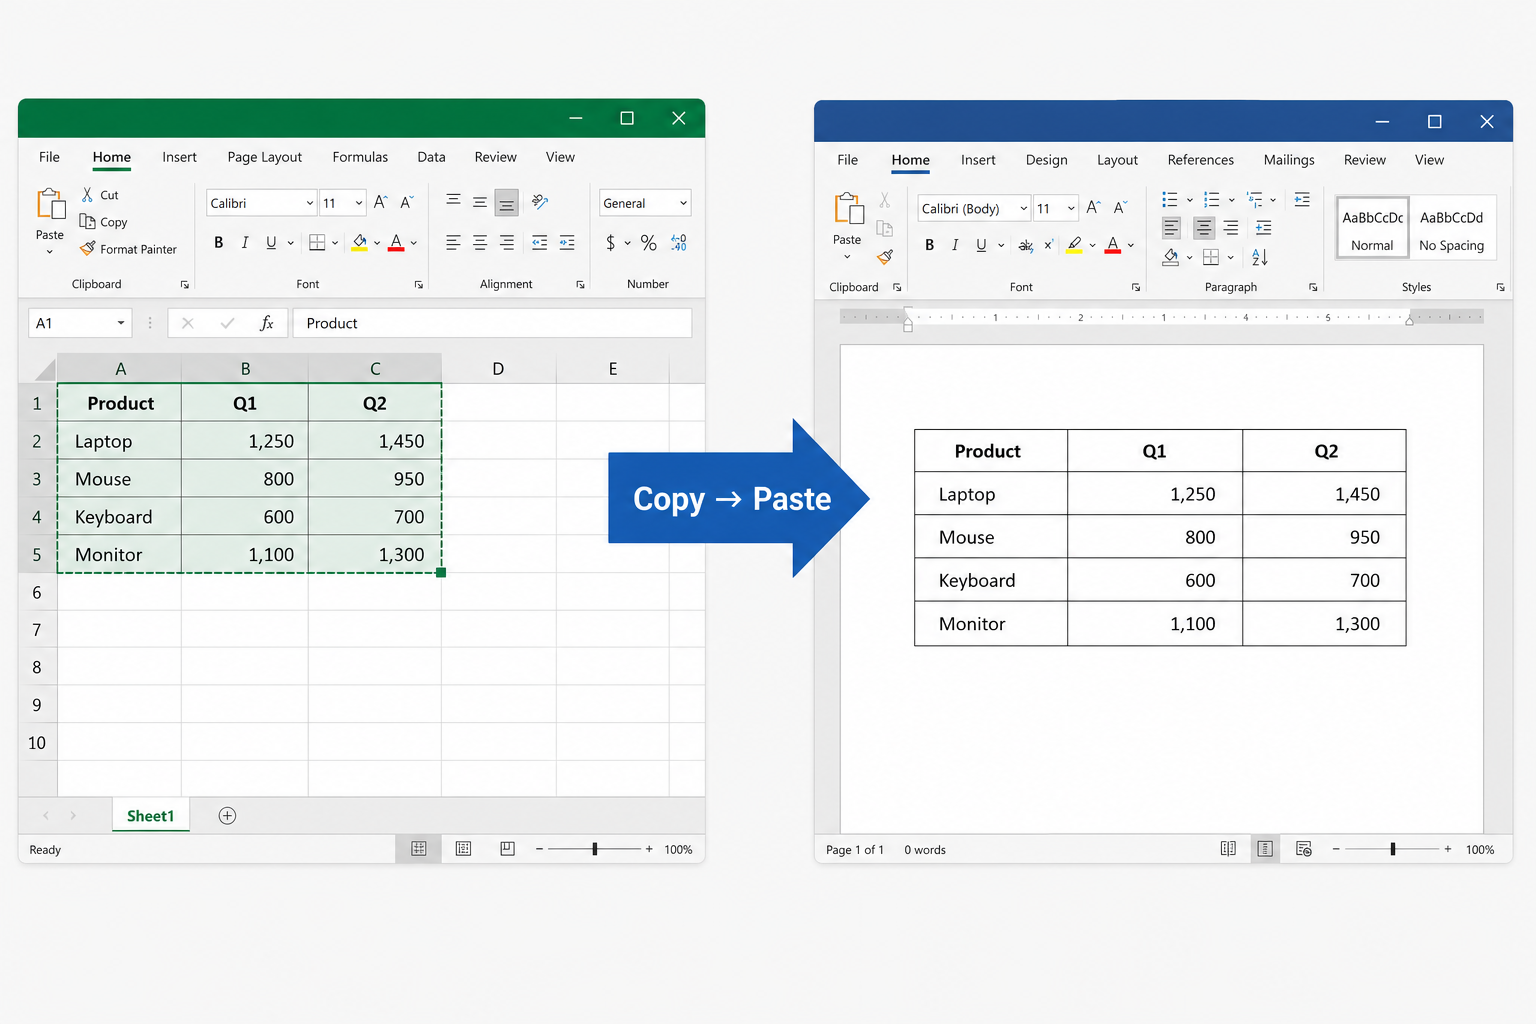
Word document with layout table
PowerPoint: charts for the room, not for the data
PowerPoint is built to present, so its chart tool is designed around a slide rather than a workbook. Insert → Chart gives you the same chart families as Excel, and the data sits in an embedded sheet you open with Edit Data.
Two limits show up in practice. First, the data is a copy: a chart on slide six does not follow the workbook your finance team updated this morning, so someone has to paste the new figures and check the axis labels each time. Second, the slide is a fixed canvas — there is no sorting a table by a column, no filtering to the last quarter, no calculated row.
Where PowerPoint wins is the last mile. An Excel chart pasted as a picture freezes the formatting but loses the data; pasted with Keep Source Formatting and Link Data it updates, and the file path becomes part of the deck. For a board pack that is the right trade-off. For the model itself, it is the wrong place to build anything.
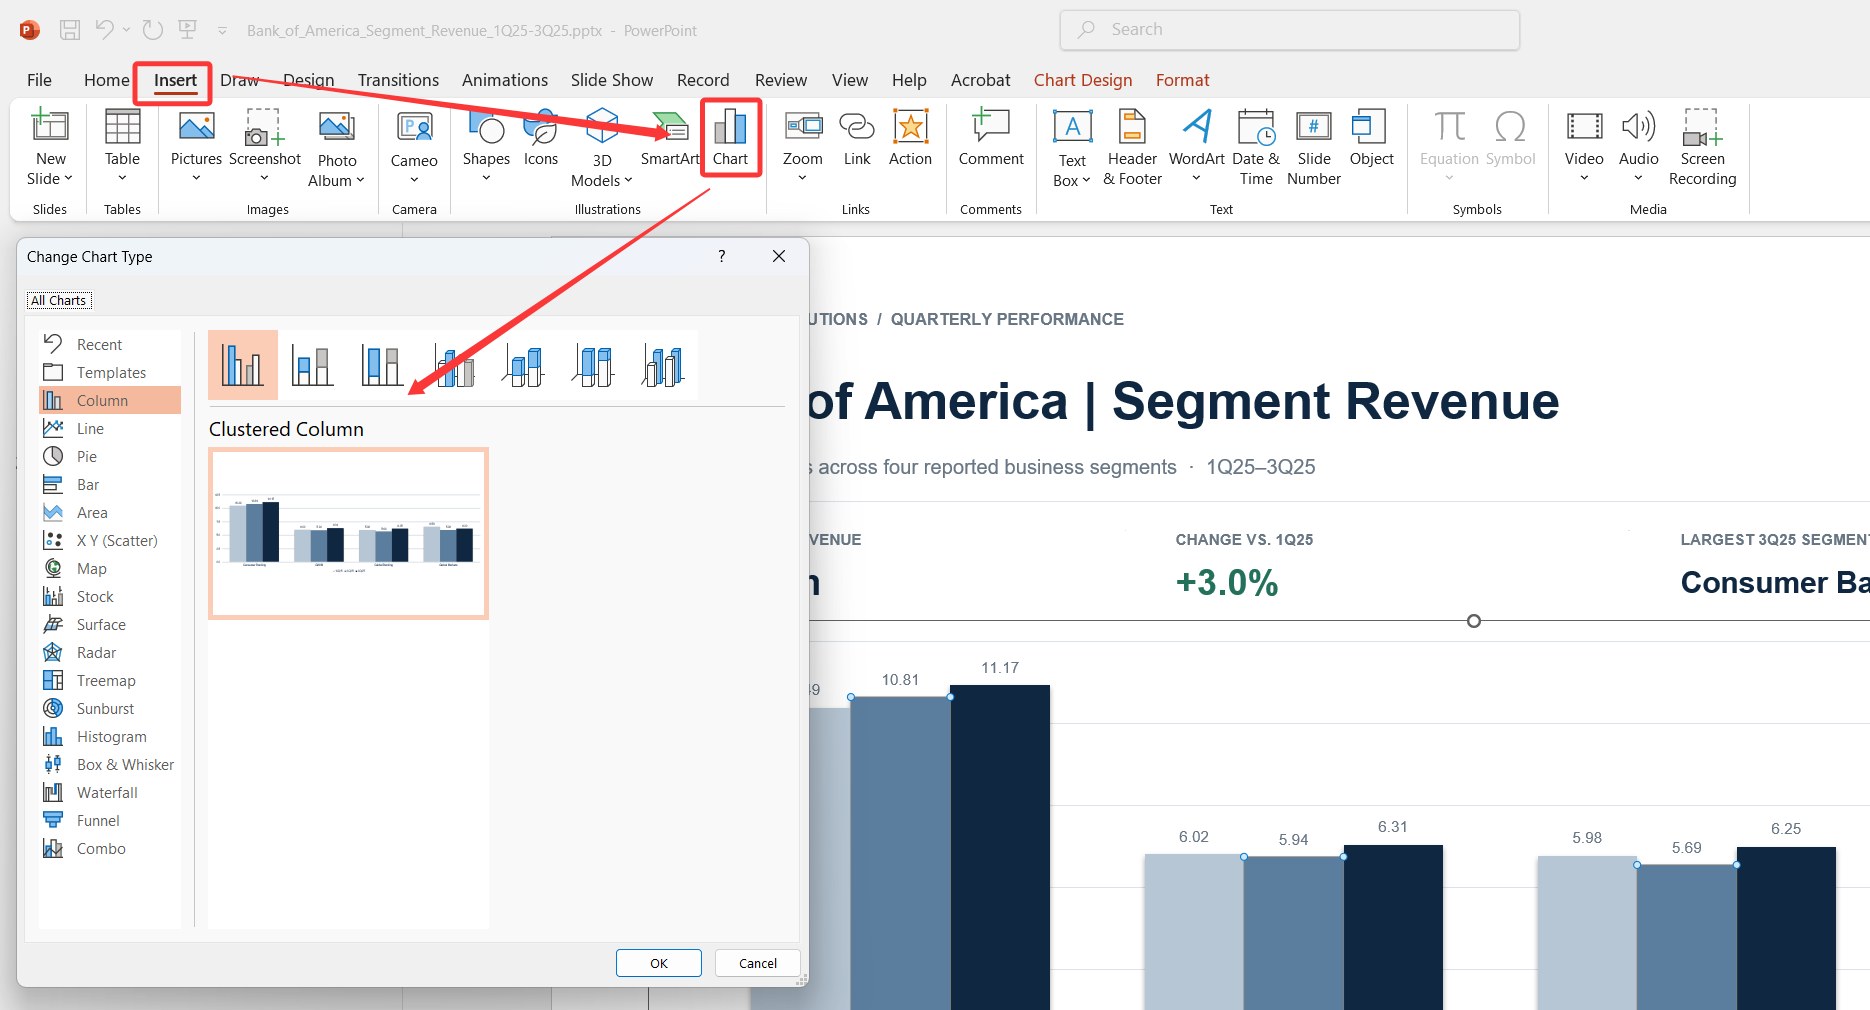
PowerPoint slide with a column chart
Which chart answers which question
A chart is an argument about the shape of the data. Choose the wrong family and the reader ends up arguing with the chart instead of the number.
| The question | Chart | Why it works |
|---|---|---|
| Which category is largest? | Bar or column | Length is the easiest comparison the eye makes |
| How did it change over time? | Line | Slope reads as rate of change |
| What share of the total? | Pie or doughnut, five slices at most | Angles get hard to compare past five; switch to a bar |
| Do these two variables relate? | Scatter | Position on two axes shows correlation, not cause |
| How is the data spread? | Histogram or box plot | Shows the cluster and the long tail a bar chart hides |
| How far from target? | Bullet or combo | Actual and target share an axis, so the gap is visible |
Two rules survive every style guide. Put the value on one axis and nothing else — a chart with two y-axes can be made to prove either side of an argument. And label the unit once, in the axis title, instead of repeating “$” on every tick.
None of this is an Excel-only skill, but Excel is where the chart is created, and it is the only app in the suite that can regenerate the chart after the data changes. PowerPoint and Word both take a copy.
Outlook: the one Microsoft Office app with no spreadsheet layer
Outlook is mail, calendar and contacts. It has no grid, no formula bar and no chart tool, and it does not pretend to: the ribbon offers a table you can insert into the message body, which is a formatting grid with the same limits as the one in Word and none of the calculation.
That does not make it useless in a spreadsheet workflow. Outlook is where the file travels:
Attaching an .xlsx keeps it editable, unlike a PDF export.
Preview lets a recipient read the first sheet without opening Excel.
Shared links to OneDrive or SharePoint replace attachments when the workbook is too large.
Calendar invites are how the review meeting gets booked — the part of the process nobody puts in the tutorial.
If you need to edit the numbers, Outlook hands the file to Excel. It never edits them itself.
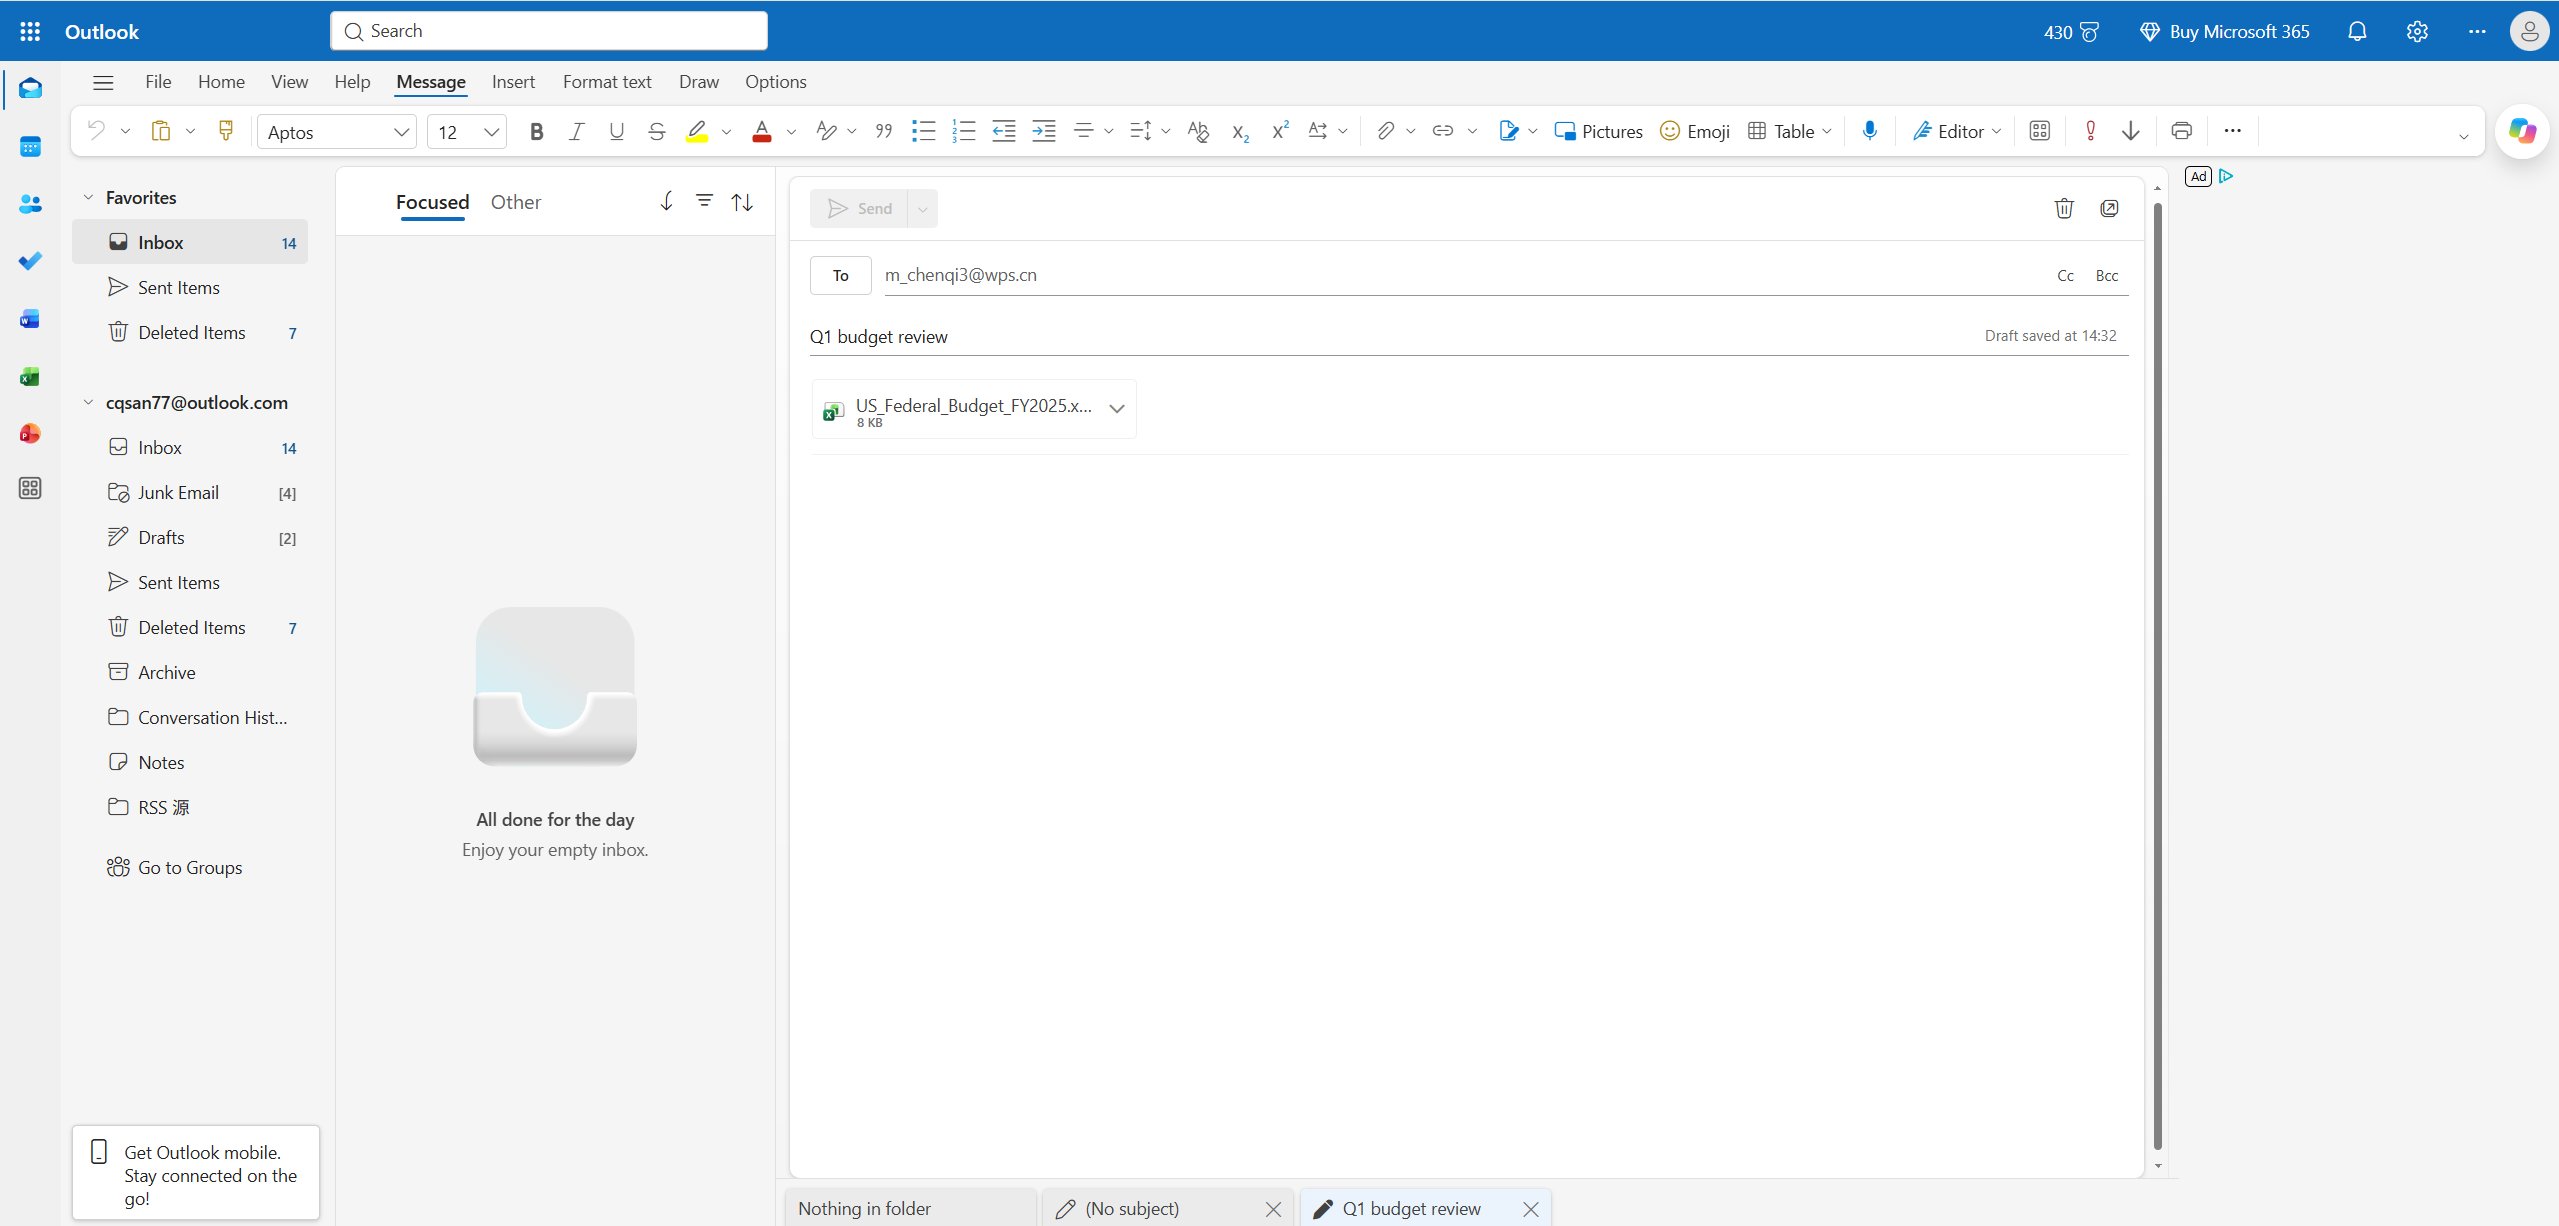
Outlook message with Excel attachment
What happens when two people edit the same Microsoft Office file
Two people in one workbook is a different problem from two people emailing versions of it, and the difference shows up in what you can see.
Real co-authoring needs the file on OneDrive or SharePoint and a Microsoft 365 subscription — then both editors see each other's cursor, changes merge as they type, and Version History lets you roll a sheet back without asking anyone to re-send it. The older Share Workbook feature is a separate mechanism, and it conflicts with co-authoring: turning one on usually disables the other, which is why a workbook that suddenly refuses to share is often just a legacy setting.
Comments on a cell stay attached to the number even after rows are inserted, unlike “the figure on page two” in an email.
Track Changes in Excel records edits to the workbook; in Word it records edits to text, which is why the two dialogs look different.
Email attachments fork the file: every reply creates another copy, and the version with the right numbers is rarely the one with the latest timestamp.
For a team that cannot move the file to SharePoint, the practical answer is a shared link with edit rights, or a single owner who merges changes into one master copy at a fixed time each day. Both beat five people editing five files called budget_final_v3.
Which Microsoft Office product fits each task
Read the left column first. The right column is the app that will not waste your afternoon.
| Task | Best Microsoft Office app | Why |
|---|---|---|
| Build a budget, tracker or forecast | Excel | Formulas recalculate, tables expand, totals stay correct |
| Summarise thousands of rows | Excel | PivotTables and filters on real records |
| Make a chart that updates itself | Excel | Charts are bound to data, not to a pasted picture |
| Lay out a small table in a document | Word | Page layout, headers and print control |
| Show one chart to a room | PowerPoint | Full-slide sizing and speaker flow |
| Send the workbook and book the review | Outlook | Attachment, preview and calendar in one place |
Two habits remove most of the friction. First, keep every calculation in Excel and export only the final picture — a table pasted into Word or a chart on a slide is a snapshot, and snapshots go stale silently. Second, when a deck is revised every month, link the chart to the workbook instead of rebuilding it, so the number on the slide cannot drift from the number in the model.
The Best Free Alternative: WPS Office
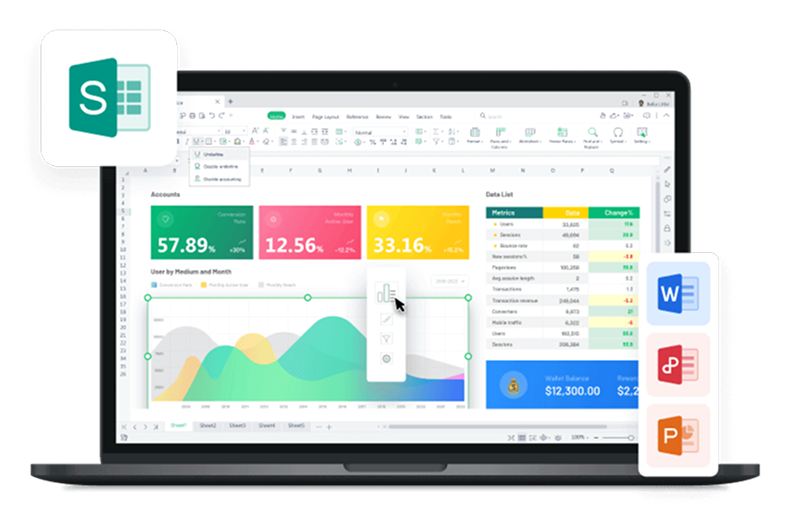
The four apps above map almost one to one onto a free suite, which matters when a licence is not in the budget or the file has to open on a machine you do not own. WPS Spreadsheet covers the Excel role, WPS Writer covers Word, WPS Presentation covers PowerPoint, and all three open and save .xlsx, .docx and .pptx in place.
What carries over is the part this article has been about: tables that expand, charts bound to data, formulas that recalculate, and pivot tables that still summarise a real range. The interface follows the familiar ribbon, so a shortcut learned in Excel still works, and the whole suite installs in one download on Windows, macOS, Linux, Android and iOS.
Free to use, with documents, slides, spreadsheets and a PDF toolkit in one install.
Opens Microsoft formats directly, so a file can travel in both directions.
Runs offline on the desktop app — no upload required to edit a table.
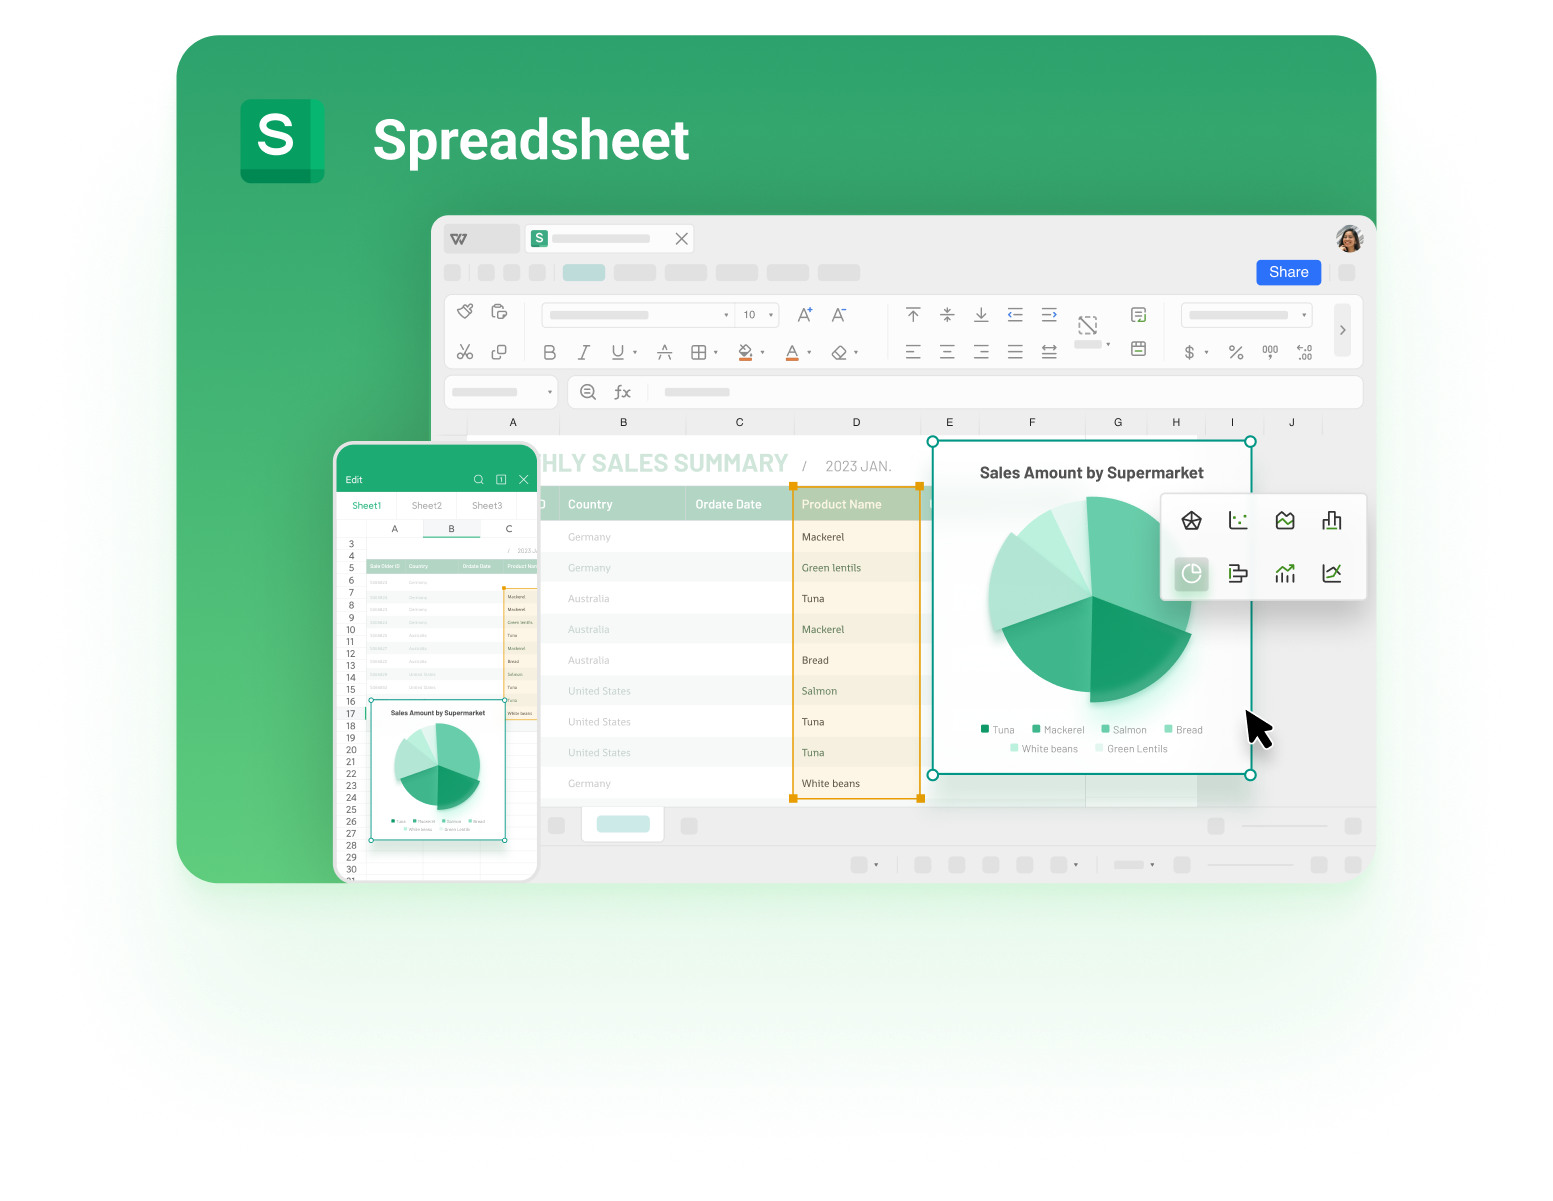
WPS Spreadsheet with table and chart
FAQs
Which Microsoft Office product is best for spreadsheets?
Excel. It is the only app in the suite with a calculation engine, tables that expand, PivotTables and charts bound to live data. Word, PowerPoint and Outlook can display a table, but none of them recalculates it.
Can Word create charts?
Yes, through Insert → Chart, but the chart is backed by a small data grid stored inside the document rather than a workbook. It works for a one-off report and becomes double entry as soon as the numbers are revised elsewhere.
Does PowerPoint have spreadsheet features?
Only the embedded data sheet behind a chart, opened with Edit Data. It holds the numbers for that one chart — there is no sorting, filtering or calculated column on a slide.
Can Outlook open Excel files?
It can preview the first sheet of an attachment, and it can open the file in Excel or in a browser tab with Excel for the web. Outlook itself has no grid, formulas or chart tools, so the editing always happens somewhere else.
Can you insert a table in Outlook?
Yes, from the insert menu in the message body, but it is a formatting grid: no formulas, no sorting beyond the basic dialog, no chart tool. A table in an email is a picture of data — if the numbers will change, attach the workbook instead.
Does Excel for the web have every chart type?
The common families — column, bar, line, pie, scatter, area — are all there. The desktop app has the longer tail: histogram, waterfall, funnel, box and whisker, treemap, plus combination charts with a secondary axis. If a chart type is missing in the browser, the file still opens; you just cannot add that chart there.
Is Excel included in every Microsoft Office plan?
The desktop app is included in the Microsoft 365 plans and in Office 2021 and 2024 suites; the browser version is available with a free Microsoft account at a reduced feature set. Either way, the spreadsheet work belongs there rather than in Word.

Summary
Spreadsheets, tables and charts: Excel — the only app in Microsoft Office with a calculation engine.
Word: good for a layout table inside a document; charts there are embedded copies.
PowerPoint: charts sized for a slide; link them to the workbook if the numbers change monthly.
Outlook: the delivery route — attachments, previews and the meeting invite.
No licence: WPS Office covers the same three roles and opens the same file formats for free.