

'%3e%3cpath%20d='M8%200C12.4183%200%2016%203.58172%2016%208C16%2012.4183%2012.4183%2016%208%2016C3.58172%2016%200%2012.4183%200%208C0%203.58172%203.58172%200%208%200ZM11.6162%204.38379C11.2257%203.99337%2010.5927%203.99338%2010.2021%204.38379L8%206.58594L5.79785%204.38379C5.40732%203.99334%204.77429%203.99329%204.38379%204.38379C3.99331%204.77429%203.99335%205.40733%204.38379%205.79785L6.58594%208L4.38379%2010.2021C3.99348%2010.5927%203.99341%2011.2257%204.38379%2011.6162C4.77426%2012.0066%205.40734%2012.0065%205.79785%2011.6162L8%209.41406L10.2021%2011.6162C10.5927%2012.0066%2011.2257%2012.0067%2011.6162%2011.6162C12.0067%2011.2257%2012.0066%2010.5927%2011.6162%2010.2021L9.41406%208L11.6162%205.79785C12.0066%205.40735%2012.0066%204.77429%2011.6162%204.38379Z'%20fill='%23080E17'%20fill-opacity='0.46'/%3e%3c/g%3e%3cdefs%3e%3cclipPath%20id='clip0_3761_713'%3e%3crect%20width='16'%20height='16'%20fill='white'/%3e%3c/clipPath%3e%3c/defs%3e%3c/svg%3e)



'%3e%3cpath%20fill-rule='evenodd'%20clip-rule='evenodd'%20d='M21.4999%2010.9993C21.4999%205.20009%2016.7986%200.498901%2010.9993%200.498901C5.19994%200.498901%200.498657%205.20009%200.498657%2010.9993C0.498657%2016.2404%204.33858%2020.5844%209.35855%2021.3722V14.0346H6.69238V10.9993H9.35855V8.68594C9.35855%206.05427%2010.9262%204.60062%2013.3248%204.60062C14.4736%204.60062%2015.6753%204.80571%2015.6753%204.80571V7.38979H14.3512C13.0468%207.38979%2012.64%208.19921%2012.64%209.0296V10.9993H15.5523L15.0867%2014.0346H12.64V21.3722C17.66%2020.5844%2021.4999%2016.2404%2021.4999%2010.9993Z'%20fill='%231568EA'/%3e%3c/g%3e%3c/svg%3e)


'%3e%3cpath%20d='M2.42045%2022.1876H6.31818V12.7217L0.75%208.54553V20.5171C0.75%2021.4414%201.49892%2022.1876%202.42045%2022.1876Z'%20fill='%234285F4'/%3e%3cpath%20d='M19.682%2022.1876H23.5797C24.5041%2022.1876%2025.2502%2021.4387%2025.2502%2020.5171V8.54553L19.682%2012.7217'%20fill='%2334A853'/%3e%3cpath%20d='M19.682%205.48293V12.7216L25.2502%208.54543V6.31816C25.2502%204.25236%2022.8921%203.07469%2021.2411%204.31361'%20fill='%23FBBC04'/%3e%3cpath%20d='M6.31824%2012.7217V5.48303L13.0001%2010.4944L19.6819%205.48303V12.7217L13.0001%2017.733'%20fill='%23EA4335'/%3e%3cpath%20d='M0.75%206.31816V8.54543L6.31818%2012.7216V5.48293L4.75909%204.31361C3.10534%203.07469%200.75%204.25236%200.75%206.31816Z'%20fill='%23C5221F'/%3e%3c/g%3e%3cdefs%3e%3cclipPath%20id='clip0_2954_7305'%3e%3crect%20width='24.5'%20height='18.375'%20fill='white'%20transform='translate(0.75%203.8125)'/%3e%3c/clipPath%3e%3c/defs%3e%3c/svg%3e)


For analysts, researchers, and business professionals, finding the best spreadsheet software for data analysis is the difference between hours of manual work and instant insights. In 2026, the category has split into three distinct camps: traditional incumbents (Excel, Google Sheets), AI-native analysts (Julius AI, Anomaly AI), and high-value hybrids that combine desktop-grade compatibility with modern AI features (WPS Spreadsheet).
Below, we compare 8 top spreadsheet data analysis tools across pricing, AI capabilities, data volume handling, and user fit — so you can pick the right one without trial and error.
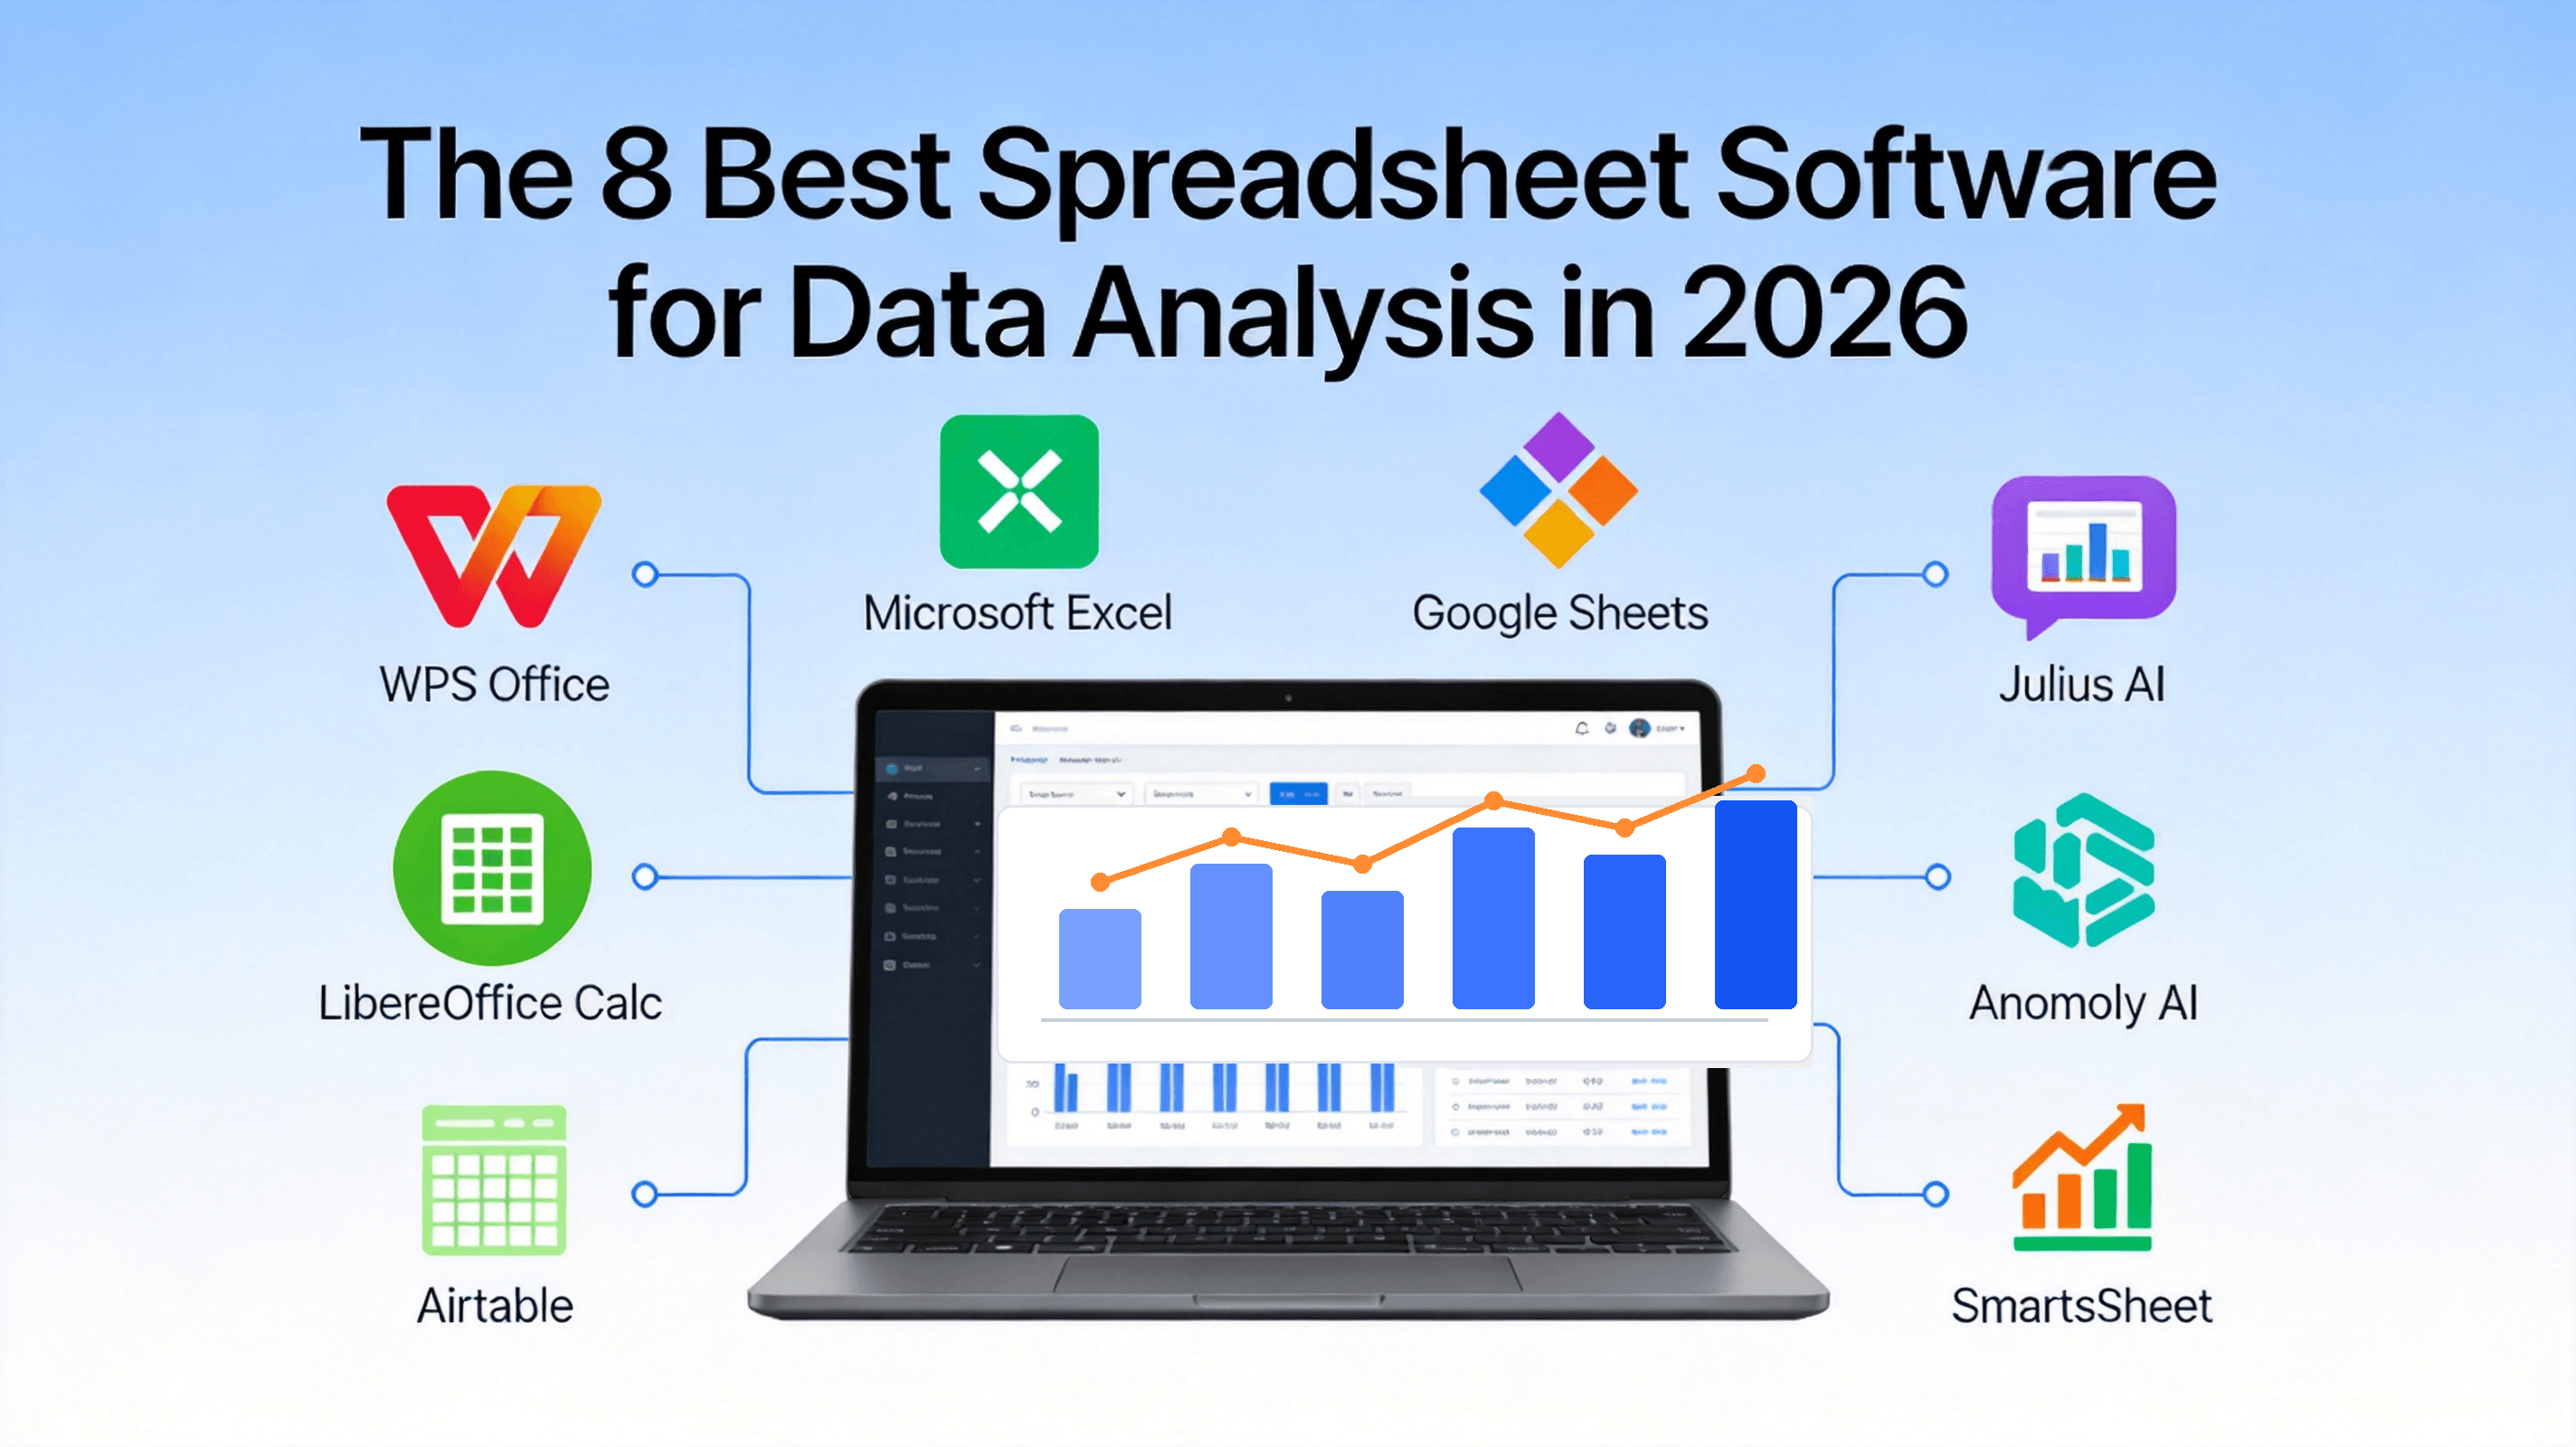
The 8 Best Spreadsheet Software for Data Analysis in 2026: AI & Traditional Tools Compared
TL;DR: Quick Answer for the Best Spreadsheet Software for Data Analysis in 2026
"For most analysts, WPS Spreadsheet offers the best value — it combines Excel-grade compatibility with integrated AI features at a free price point."
If you need advanced statistical modeling, Excel remains the gold standard. For real-time team collaboration, choose Google Sheets. For AI-native data analysis without formulas, Julius AI and Anomaly AI are the emerging leaders.
Best overall for value & compatibility: WPS Spreadsheet (free, Excel-like, built-in AI)
Best for advanced analytics: Microsoft Excel (Power Query, Copilot, VBA)
Best for real-time collaboration: Google Sheets (cloud-native, multi-user)
Best for AI-native analysis: Julius AI (chat-to-chart) and Anomaly AI (large files)
Best for privacy & offline: LibreOffice Calc (open-source, no telemetry)
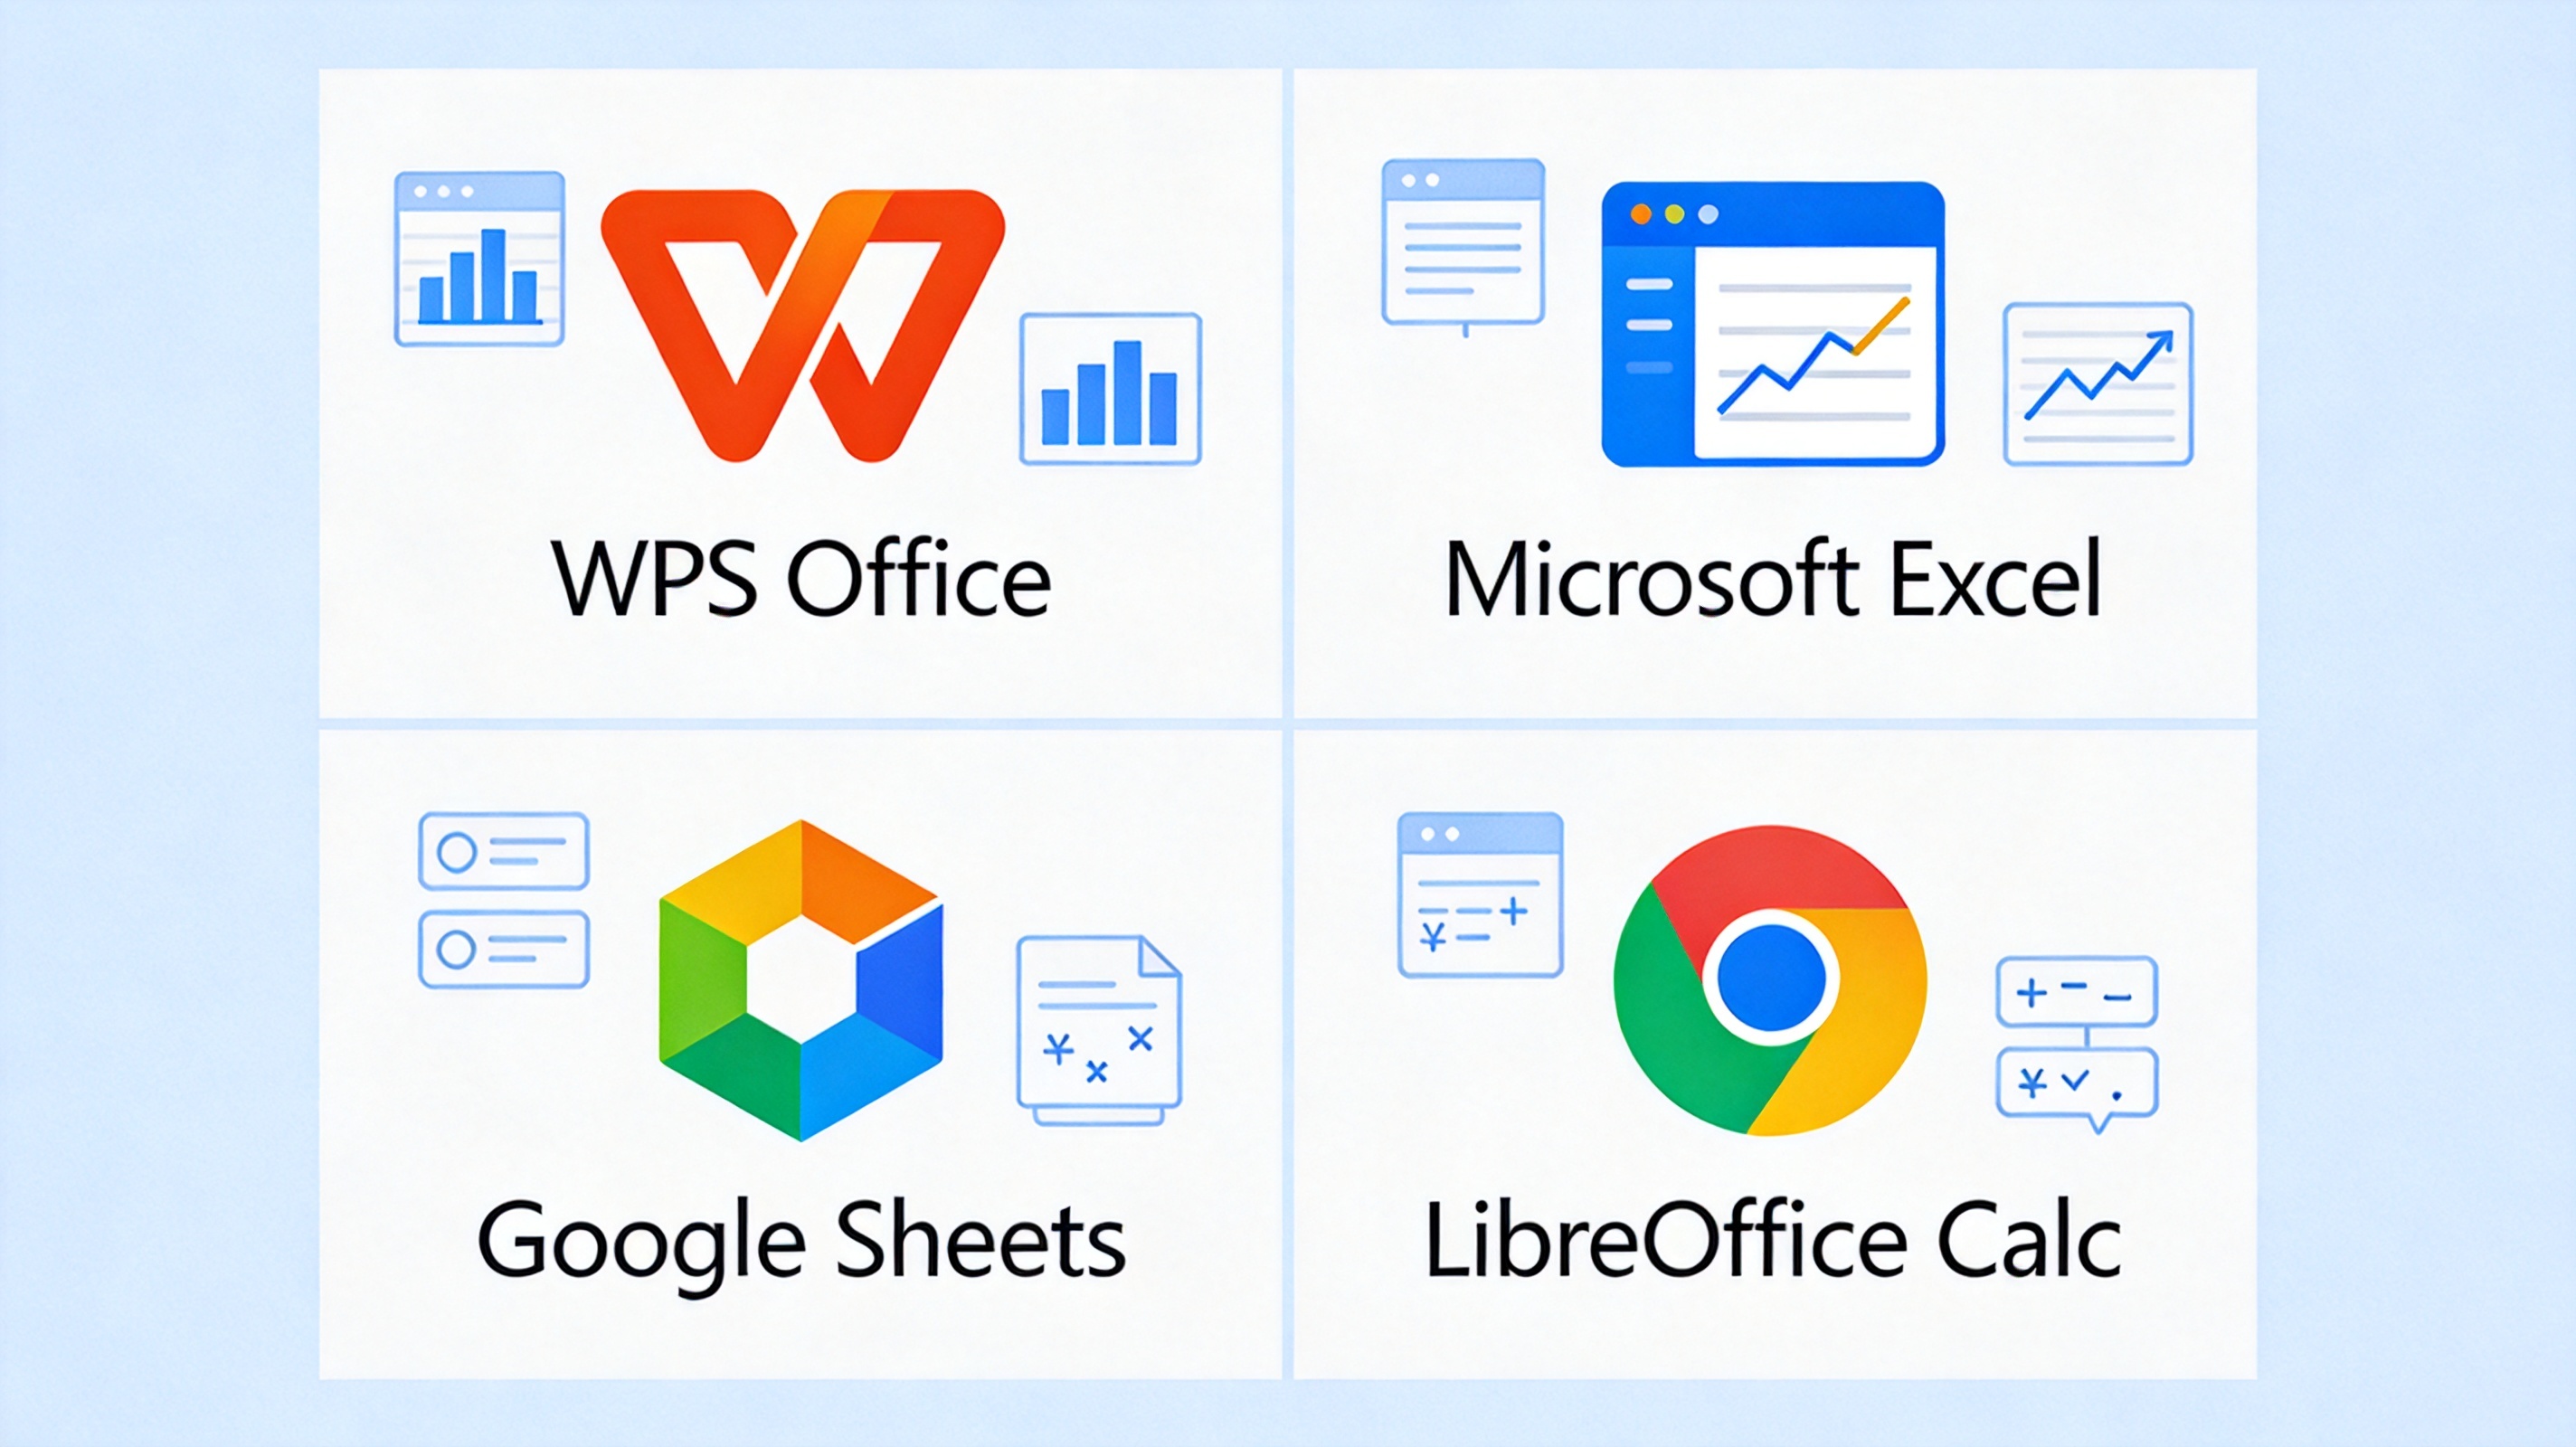
Spreadsheet software comparison chart — pricing, AI features, and user fit at a glance
Comparison Table: Best Spreadsheet Data Analysis Tools 2026
| Software | Starting Price | AI Features | Best For | Free Tier |
|---|---|---|---|---|
| Microsoft Excel | $6.99/mo (M365) | Copilot for data queries | Enterprise analysts | Web only |
| WPS Spreadsheet | Free / $29.99/yr | WPS AI: formula gen, summaries | Value-conscious users | Full desktop free |
| Google Sheets | Free / $6/mo | Gemini: automated insights | Collaborative teams | Yes |
| LibreOffice Calc | Free (open source) | None natively | Privacy-focused users | Full free |
| Julius AI | $20/mo | Chat-to-graph, Python code | Data scientists | Limited free |
| Anomaly AI | $25/mo | Agentic analysis, 1GB files | Analysts with large data | Free tier |
| Airtable | Free / $20/mo | AI categorization | Project managers | Yes |
| Smartsheet | $9/mo | AI formula builder | Enterprise ops | No |


1. Microsoft Excel: The Heavyweight for Spreadsheet Data Analysis
Think of Excel as the Swiss Army knife of data analysis — it has a tool for everything, if you know where to find it. Its Power Query can transform messy raw data into clean tables in a few clicks, PivotTables summarize millions of rows in seconds, and VBA macros automate repetitive workflows that would otherwise take hours. The 2026 addition of Microsoft 365 Copilot means you can type "forecast next quarter's revenue based on last 12 months" and get instant projections without touching a formula bar.
Key capabilities:
Power Query for ETL (extract, transform, load) from multiple data sources
PivotTables for multi-dimensional data grouping and aggregation
VBA macro automation for repetitive analytical workflows
400+ built-in functions including financial, statistical, and engineering
Monte Carlo simulation via Analysis ToolPak add-in
Copilot natural-language querying for instant formula/chart generation
Best for: Enterprise analysts and finance teams building financial models or running advanced statistical analysis.
Pricing: $6.99/month (M365 Personal), $9.99/month (M365 Family). Free web version with limited features.
Trade-offs: High subscription cost; steep learning curve for advanced features; desktop-only for full power; no real-time collaborative editing in the desktop app.
2. WPS Spreadsheet: The High-Value Champion with AI
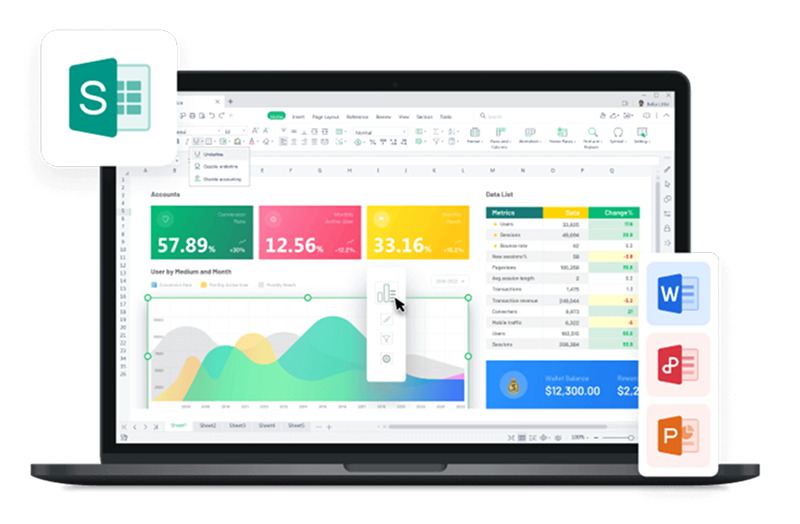
Imagine getting 95% of Excel's power — for free. That's WPS Spreadsheet in a nutshell. It opens .xlsx, .xlsm, and .csv files with near-perfect formatting preservation, so that shared workbook from your Excel-using colleague renders exactly as intended. What sets it apart in 2026 is WPS AI, built directly into the toolbar: highlight a column of sales data, type "give me the month-over-month growth rate," and it generates the formula instantly. No syntax memorization, no nested IF statements.
Key capabilities:
Native .xlsx/.xlsm compatibility with near-perfect formatting preservation
WPS AI for formula generation, data summarization, trend extraction
PivotTables with drag-and-drop field configuration
Advanced charting (waterfall, histogram, box-and-whisker, sunburst)
Built-in PDF converter for report export
Split View for side-by-side sheet comparison
Best for: Researchers, small business owners, freelancers, and students who need professional-grade analysis without recurring subscription costs.
Pricing: Free (Standard edition with full desktop features, ads included). Premium at $29.99/year (ad-free, 20 GB cloud storage, PDF editing, OCR, unlimited templates).
Trade-offs: Premium WPS AI features (advanced data analysis, batch processing) require Premium upgrade; smaller add-in ecosystem compared to Excel; cloud collaboration is less mature than Google Sheets.
3. Google Sheets: The Cloud Leader in Spreadsheet Data Analysis
If your team spans three time zones and you need everyone looking at the same numbers simultaneously, Google Sheets is the obvious pick. It pioneered real-time multi-user editing in spreadsheets, and its Explore feature auto-suggests charts and insights as you type. The Gemini AI integration brings natural-language formula generation — just type "calculate average order value by region" and it writes the formula for you. Google Apps Script adds automation via JavaScript macros.
Key capabilities:
Real-time multi-user collaboration with full version history and comments
Explore auto-insights for one-click chart and summary suggestions
Gemini AI for natural-language formula and pivot table generation
Google Apps Script automation (JavaScript-based macros and custom functions)
Connected sheets integration with BigQuery, Looker, and Salesforce
400+ functions including GOOGLEFINANCE, QUERY, and IMPORTRANGE
Best for: Remote teams, marketers, and educators needing instant collaborative analysis across geographies.
Pricing: Free (15 GB storage). Business Starter at $6/user/month, Business Standard at $12/user/month. Enterprise plans available.
Trade-offs: Performance degrades beyond 500,000 rows; fewer advanced statistical functions than Excel or WPS; limited offline capability; weaker desktop experience.
4. LibreOffice Calc: The Open-Source Spreadsheet for Data Analysis
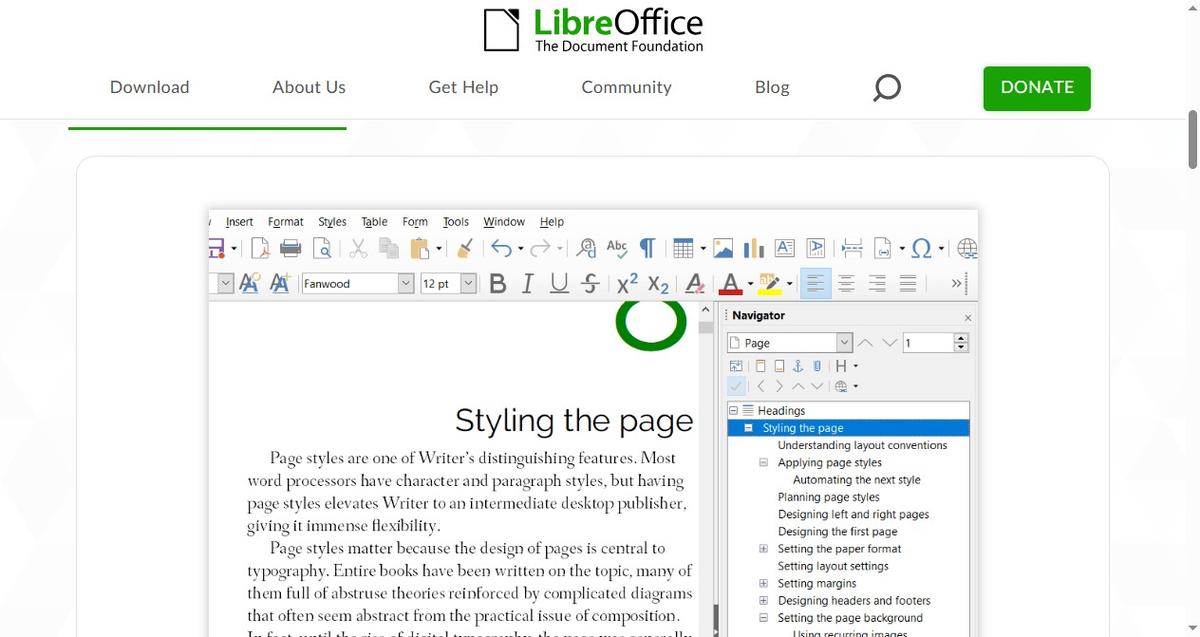
For users who value privacy above all else, LibreOffice Calc is a sanctuary. It is fully open-source, sends zero telemetry, and runs entirely offline. Its DataPilot (the open-source answer to PivotTables) handles complex data grouping, and the built-in scenario manager lets you run what-if analyses without cloud dependencies. Yes, the interface looks like it is from 2010, and there is no native AI assistant — but for academic researchers handling sensitive data, Calc's freedom is worth more than flashy features.
Key capabilities:
DataPilot for multi-dimensional grouping (equivalent to PivotTables)
Scenario Manager for what-if analysis and goal-seeking
Solver for optimization and linear programming problems
500+ functions across statistical, financial, and engineering domains
Native ODF format support with ISO standard compliance
Macro recording in Basic, Python, and JavaScript
Best for: Academic researchers, privacy-conscious users, and organizations strictly opposed to SaaS subscriptions or vendor lock-in.
Pricing: Free (open source, GNU LGPL). No subscriptions, no paid tiers, no telemetry.
Trade-offs: Outdated UI design; no native AI assistant; limited cloud collaboration; compatibility issues with complex Excel formatting (charts, conditional formatting).
5. Julius AI: The Conversational Data Analysis Tool
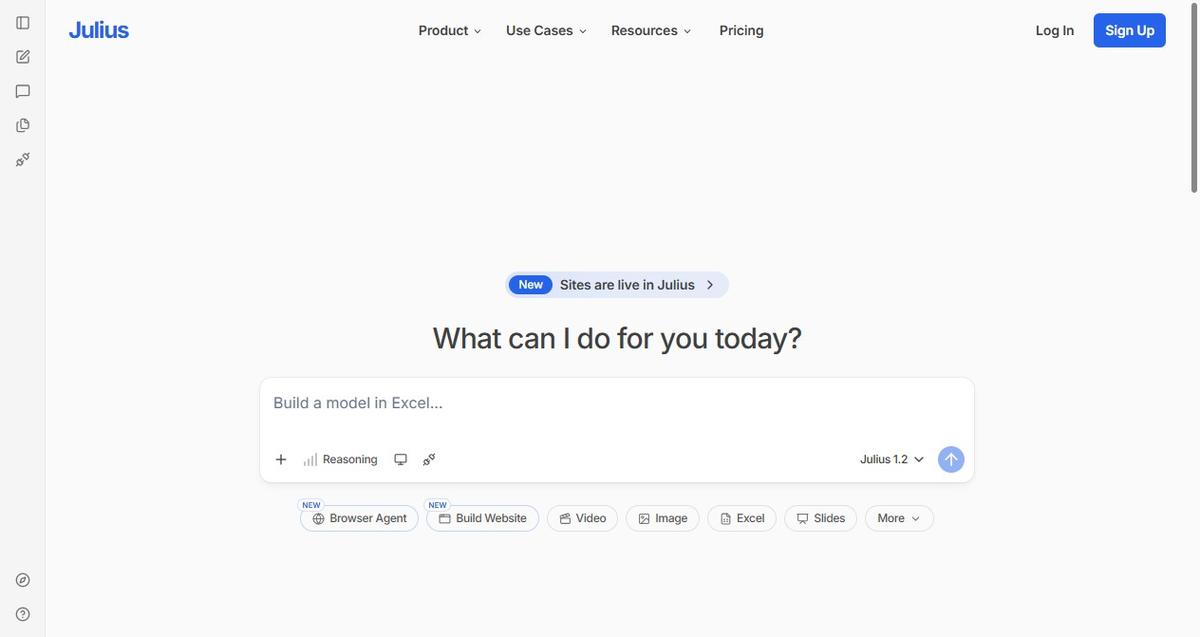
Julius AI reimagines data analysis as a conversation. Instead of clicking through menus or memorizing functions, you upload your CSV or Excel file and start chatting: "Show me the correlation between marketing spend and new signups," "create a scatter plot with a trend line," or "what factors predict customer churn most strongly?" Behind the scenes, Julius writes Python code to execute each request, producing publication-ready charts and statistical summaries. It is ideal for exploratory data analysis when you do not know exactly what you are looking for yet.
Key capabilities:
Conversational data analysis via natural-language prompts
Automatic Python and R code generation for every analysis
Publication-ready charts (matplotlib, seaborn, plotly, ggplot)
Statistical testing (t-tests, ANOVA, regression, chi-square)
Multi-format import: CSV, Excel, PDF, Google Sheets, SQL databases
Export analysis as reports, dashboards, or interactive notebooks
Best for: Data scientists, marketing analysts, and academic researchers who prefer conversational data interaction over formula-based spreadsheet work.
Pricing: Free tier (limited messages). Plus at $20/month (2,000 credits), Pro at $45/month (4,500 credits). Annual billing reduces Plus to $16/month.
Trade-offs: Not a spreadsheet-grid interface — works as a chat overlay; files need clean formatting before upload; output is an analysis report, not an editable spreadsheet.
6. Anomaly AI: Purpose-Built for Large Spreadsheet Analysis
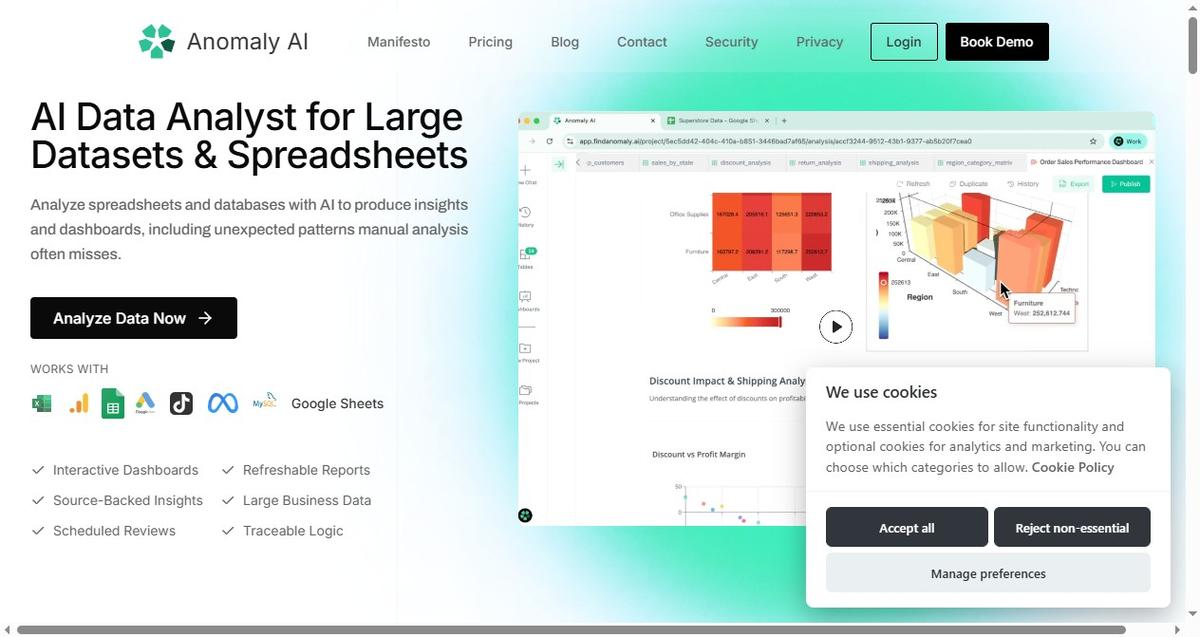
When your dataset is too big for Excel to open, Anomaly AI is designed expressly for that scenario. It handles files up to 1 GB with millions of rows — think point-of-sale transaction logs, server performance metrics spanning years, or full census datasets. Upload the file, describe the analysis you want, and Anomaly's agentic AI processes it into dashboards, automated reports, and scheduled alerts. A standout feature is its transparency: you can inspect the source data, assumptions, and generated SQL behind every result, making it trustworthy for audit-sensitive work.
Key capabilities:
1 GB file support handling millions of rows per upload
Agentic AI for automated dashboard and report generation
Scheduled data refreshes and automated alert triggers
Cross-source analysis combining Excel, GA4, BigQuery, MySQL
Transparent SQL generation with full audit trail
Export to interactive dashboards and scheduled PDF reports
Best for: Analysts working with large datasets exceeding spreadsheet limits, or those needing automated dashboard-ready outputs from raw files.
Pricing: Free tier (limited). Starter at $16/month, Pro at $25/month, Team at $45/seat/month.
Trade-offs: Not an in-spreadsheet add-on — operates as a separate web platform; requires uploading data rather than working within a spreadsheet interface.
7. Airtable: The Relational Database for Structured Data
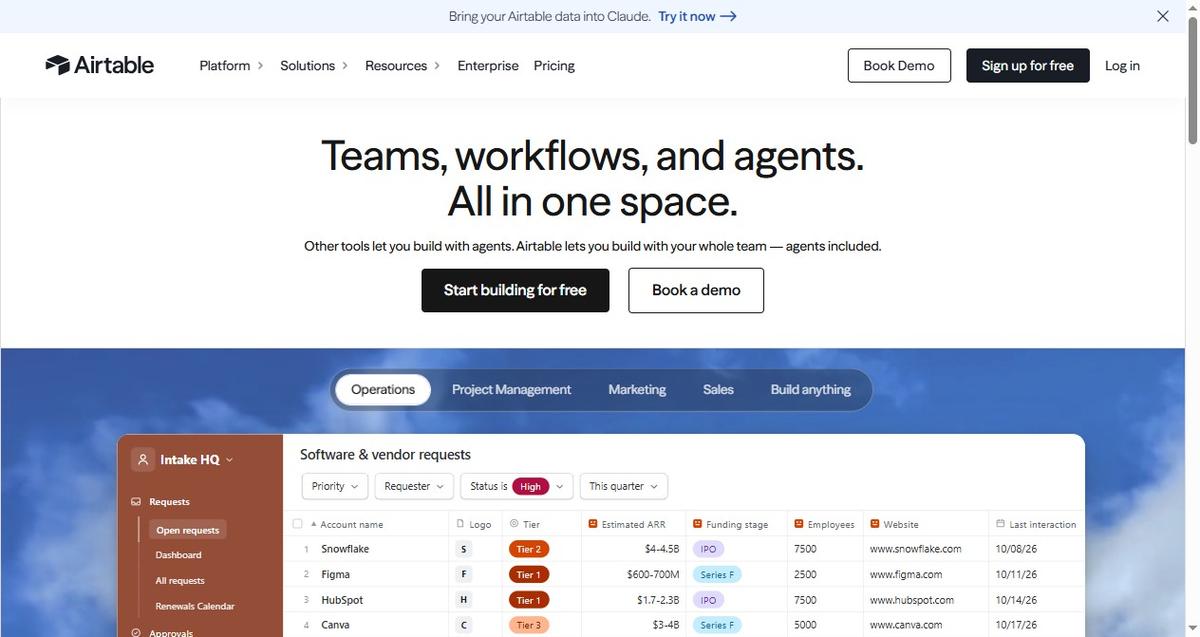
Airtable is what you get when a spreadsheet and a database have a very practical baby. It offers views that no traditional spreadsheet can match — Grid, Kanban, Gantt, Calendar, and Gallery — all linked dynamically to the same underlying data. AI features include automated record categorization and workflow summaries based on your field values. It shines for structured data management: tracking bug reports, organizing content calendars, or managing inventory. But if your work involves heavy number crunching or regression analysis, Airtable is not the right tool.
Key capabilities:
Five linked views: Grid, Kanban, Gantt, Calendar, Gallery
AI-powered record categorization and field summarization
Relational database structure with linked record lookups
100+ pre-built templates for common business workflows
Zapier, Make, and API integrations for data pipeline automation
Rich formulas with rollup, count, and lookup field types
Best for: Product managers, content teams, and operational researchers tracking structured categorical data with relational needs.
Pricing: Free (1,000 records/base, 2 GB storage). Team at $20/user/month, Business at $45/user/month. Enterprise plans available.
Trade-offs: Not designed for heavy numerical analysis or statistical modeling; pricing scales with users; record count limits on lower tiers.
8. Smartsheet: The Enterprise Work Management Platform
Smartsheet is the spreadsheet that project management teams actually enjoy using. It combines grid-based data entry with cross-sheet rollups, automated data collection via forms, and enterprise-grade access controls. The AI formula builder helps users construct complex calculations like "calculate task duration variance across all projects" without writing a single function from scratch. Where Smartsheet truly excels is large organizations that need to track resource allocation, project portfolios, and approval workflows in one place.
Key capabilities:
Cross-sheet data rollups and summary formulas
Automated forms for data collection from external stakeholders
Gantt charts with task dependencies and critical path visualization
AI formula builder for natural-language calculation creation
Resource management with time tracking and capacity planning
SAML/SSO, directory integration, and Data Shuttle connectors
Best for: Enterprise business users managing resource allocation, project portfolios, and cross-departmental approval workflows.
Pricing: Pro at $9/user/month (10 member limit). Business at $19/user/month (unlimited members, portfolios, SAML SSO). Enterprise custom pricing.
Trade-offs: Pricing scales aggressively with team size; limited pure statistical analysis features; overkill for simple data analysis tasks.
How to Choose the Best Spreadsheet for Data Analysis
Selecting from these spreadsheet data analysis tools requires evaluating your data volume, budget, collaboration needs, and technical comfort level.
| If You Need... | Choose | Why |
|---|---|---|
| Advanced analytics & modeling | Microsoft Excel | Power Query + Copilot for complex data work |
| Best value (free + features) | WPS Spreadsheet | Excel-grade compatibility + WPS AI at zero cost |
| Real-time team collaboration | Google Sheets | Cloud-native multi-user editing |
| AI-native data exploration | Julius AI | Chat-to-chart for fast analysis |
| Large file handling (1GB+) | Anomaly AI | Millions of rows in one upload |
| Privacy & offline use | LibreOffice Calc | Open-source with zero telemetry |
Why WPS Spreadsheet Stands Out in 2026
WPS Spreadsheet differentiates itself by solving the core dilemma most users face: pay high subscription fees for Excel or sacrifice compatibility with free tools. It delivers near-perfect .xlsx and .xlsm compatibility, ensuring shared workbooks open without broken formatting. The WPS AI assistant can generate formulas from natural-language descriptions, summarize cell ranges, and extract trends — all within the familiar spreadsheet grid. Combined with a built-in PDF export and conversion tool, WPS lets users move from raw data to a polished report without switching applications.
How to Get Started with WPS Spreadsheet for Data Analysis
Getting started with WPS Spreadsheet's data analysis tools takes just a few minutes:
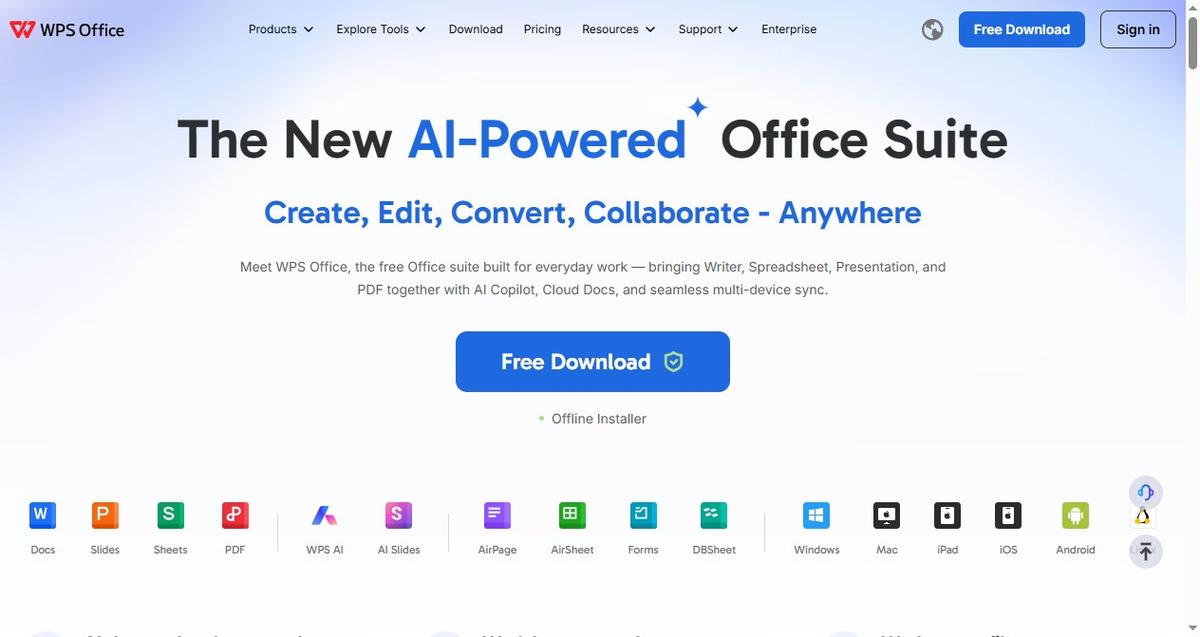
Download WPS Office — Go to wps.com and click the free download button. The installer is lightweight (~150 MB) and supports Windows, macOS, Linux, iOS, and Android.
Install and launch — Run the installer and open WPS Office. From the launcher, click "Spreadsheet" to open WPS Spreadsheet.
Open your data file — Drag and drop your .xlsx, .csv, or .xls file directly into the window. WPS Spreadsheet preserves formulas, conditional formatting, and PivotTables from Excel files.
Access data analysis tools — Use the "Data" tab on the ribbon to find Sort & Filter, Data Validation, Consolidate, What-If Analysis (Goal Seek, Scenario Manager), and PivotTable. The "Formulas" tab provides 400+ functions including VLOOKUP, INDEX-MATCH, SUMIFS, and statistical functions.
Use WPS AI for instant analysis — Look for the WPS AI icon in the toolbar. Highlight a range of cells and type natural-language prompts such as "calculate monthly growth rate," "show me the top 5 products by revenue," or "summarize this column's distribution." WPS AI generates the formula or chart instantly.
Export your results — Save as .xlsx for sharing with Excel users, or use the built-in PDF converter (File → Export to PDF) to generate readable reports directly from your spreadsheet.
Learn more about advanced WPS Spreadsheet functions and using WPS AI for business reporting in our dedicated guides.
FAQs
What is the most widely used spreadsheet software for data analysis?
Microsoft Excel remains the most widely used globally due to its enterprise adoption. However, WPS Spreadsheet and Google Sheets are rapidly gaining share — WPS especially among cost-conscious users who need full desktop-grade functionality without a subscription.
How is AI changing spreadsheet data analysis in 2026?
AI is automating data cleaning, formula generation, and chart creation. Instead of manually writing nested functions, users now type prompts to get instant visualizations. WPS AI, Excel Copilot, and Google Gemini are leading this shift, each integrated directly into the spreadsheet interface.
Can WPS Spreadsheet handle large datasets for data analysis?
Yes. WPS Spreadsheet handles files with hundreds of thousands of rows efficiently, with performance comparable to Excel on most data analysis tasks. For datasets exceeding 1 GB, dedicated tools like Anomaly AI are recommended.
Are there free spreadsheet tools with AI capabilities?
Yes. WPS Spreadsheet offers a generous free tier that includes WPS AI for formula generation and data summaries. LibreOffice Calc is completely free but lacks native AI. Google Sheets also offers a free tier with basic Gemini integration.
Which spreadsheet software for data analysis is best for students?
WPS Spreadsheet is ideal for students because it offers a full-featured free desktop version with AI assistance, perfect compatibility with school-provided Excel files, and built-in PDF export for submitting assignments.

'%3e%3cpath%20d='M19.9911%204.11386V6.471H18.5894C18.0775%206.471%2017.7322%206.57814%2017.5536%206.79243C17.3751%207.00671%2017.2858%207.32814%2017.2858%207.75671V9.44421H19.9019L19.5536%2012.0871H17.2858V18.8639H14.5536V12.0871H12.2769V9.44421H14.5536V7.49779C14.5536%206.39064%2014.8632%205.53201%2015.4822%204.92189C16.1013%204.31177%2016.9257%204.00671%2017.9554%204.00671C18.8304%204.00671%2019.509%204.04243%2019.9911%204.11386Z'%20fill='%23333333'/%3e%3c/g%3e%3cdefs%3e%3cclipPath%20id='clip0_2938_8199'%3e%3crect%20width='16'%20height='16'%20fill='white'%20transform='translate(8%204.00671)'/%3e%3c/clipPath%3e%3c/defs%3e%3c/svg%3e)
'%3e%3cpath%20d='M17.5237%2010.7813L23.4811%204H22.0699L16.8949%209.88693L12.7648%204H8L14.2469%2012.9029L8%2020.0133H9.4112L14.8725%2013.7952L19.2352%2020.0133H24M9.92053%205.04213H12.0885L22.0688%2019.0224H19.9003'%20fill='%23333333'/%3e%3c/g%3e%3cdefs%3e%3cclipPath%20id='clip0_2938_8200'%3e%3crect%20width='16'%20height='16.0134'%20fill='white'%20transform='translate(8%204)'/%3e%3c/clipPath%3e%3c/defs%3e%3c/svg%3e)


